Document
advertisement
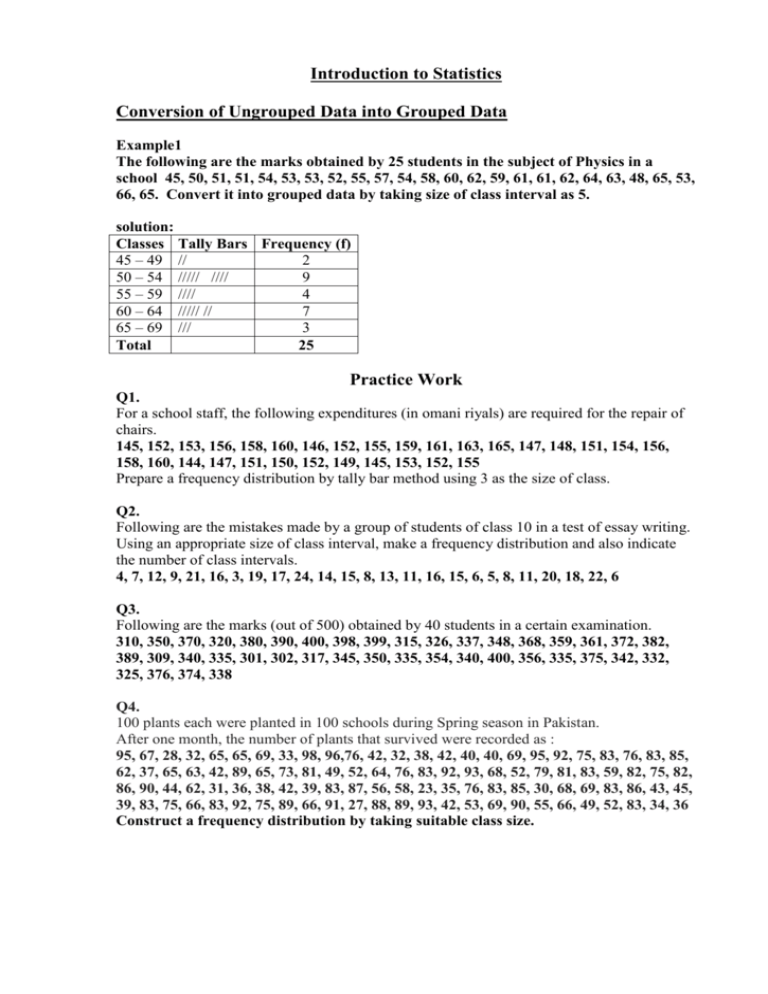
Introduction to Statistics
Conversion of Ungrouped Data into Grouped Data
Example1
The following are the marks obtained by 25 students in the subject of Physics in a
school 45, 50, 51, 51, 54, 53, 53, 52, 55, 57, 54, 58, 60, 62, 59, 61, 61, 62, 64, 63, 48, 65, 53,
66, 65. Convert it into grouped data by taking size of class interval as 5.
solution:
Classes Tally Bars Frequency (f)
45 – 49 //
2
50 – 54 ///// ////
9
55 – 59 ////
4
60 – 64 ///// //
7
65 – 69 ///
3
Total
25
Practice Work
Q1.
For a school staff, the following expenditures (in omani riyals) are required for the repair of
chairs.
145, 152, 153, 156, 158, 160, 146, 152, 155, 159, 161, 163, 165, 147, 148, 151, 154, 156,
158, 160, 144, 147, 151, 150, 152, 149, 145, 153, 152, 155
Prepare a frequency distribution by tally bar method using 3 as the size of class.
Q2.
Following are the mistakes made by a group of students of class 10 in a test of essay writing.
Using an appropriate size of class interval, make a frequency distribution and also indicate
the number of class intervals.
4, 7, 12, 9, 21, 16, 3, 19, 17, 24, 14, 15, 8, 13, 11, 16, 15, 6, 5, 8, 11, 20, 18, 22, 6
Q3.
Following are the marks (out of 500) obtained by 40 students in a certain examination.
310, 350, 370, 320, 380, 390, 400, 398, 399, 315, 326, 337, 348, 368, 359, 361, 372, 382,
389, 309, 340, 335, 301, 302, 317, 345, 350, 335, 354, 340, 400, 356, 335, 375, 342, 332,
325, 376, 374, 338
Q4.
100 plants each were planted in 100 schools during Spring season in Pakistan.
After one month, the number of plants that survived were recorded as :
95, 67, 28, 32, 65, 65, 69, 33, 98, 96,76, 42, 32, 38, 42, 40, 40, 69, 95, 92, 75, 83, 76, 83, 85,
62, 37, 65, 63, 42, 89, 65, 73, 81, 49, 52, 64, 76, 83, 92, 93, 68, 52, 79, 81, 83, 59, 82, 75, 82,
86, 90, 44, 62, 31, 36, 38, 42, 39, 83, 87, 56, 58, 23, 35, 76, 83, 85, 30, 68, 69, 83, 86, 43, 45,
39, 83, 75, 66, 83, 92, 75, 89, 66, 91, 27, 88, 89, 93, 42, 53, 69, 90, 55, 66, 49, 52, 83, 34, 36
Construct a frequency distribution by taking suitable class size.
Measures of Central Tendency:
i.
ii.
iii.
Mean
Median
Mode
Find mean, median and mode of the following values:
188, 170, 172, 125, 115, 195, 181, 190, 195, 190
Mean
We know that
Mean
Sum _ of _ all _ values
No _ of _ values
Mean
1721
= 172.1
10
Median =
Arranging in ascending order
115, 125, 170, 172, 181, 188, 190, 190, 195, 195
181 188
So the median is
= 184.5
2
--------------------------------------------------------------------------------------------------------------------Mode = 190 and 195
Mean from Grouped Data
Find mean from the grouped data:
Number of
Scores
students
(f)
20 – 24
X
Fx
25
22
25 22 = 550
25 – 29
28
27
28 27 = 756
30 – 34
32
32
32 32 = 1024
35 – 39
25
37
25 37 = 925
40 – 44
13
42
13 42 = 546
45 – 49
12
47
12 47 = 564
Total
135
We know that
Mean =
fx
f
Mean =
4365
135
Mean = 32.33
4365
Example:
The mean of 45 numbers is 80. Find sum
Mean =
80 =
Sum _ of _ all _ values
No _ of _ values
Sum
45
Sum = 80 45
Sum = 3600
Graphical Representation of Data
Measures of Variations:
1. Range 2. Standard Deviation
Find Range of 9, 11, 5, 17, 22, 7, 16, 19, 23, 25, 12, 7
Solution
Range = xm xl
= 25 – 5 = 23
Find Standard Deviation and Variance of
3.Variance
11, 13, 25, 15, 12, 18, 17, 23, 20, 16 by using direct method
Solution:
2
2
x
(x) 2
Standard Deviation = x x
n
11
121
n
13
169
2
3082 170
25
625
=
10
15
225
10
12
144
2
308.2 17
18
324
=
308.2 289
17
289
23
529
= 19.2 or 4.3
20
400
Variance = 19.2
16
256
170
3082
Find Mean, Standard Deviation and Variance of 11, 13, 25, 15, 12, 18, 17, 23, 20, 16
Mean
By using mean formula.
x
11
13
25
15
12
18
17
23
20
16
170
= 17
10
( x x) 2
36
16
64
4
25
1
0
36
9
1
xx
11 – 17 = -6
13 – 17 = -4
25 – 17 = 8
15 – 17 = -2
12 – 17 = -5
18 – 17 = 1
17 – 17 = 0
23 – 17 = 6
20 – 17 = 3
16 – 17 = -1
( x x)
2
= 192
( x x)
Standard Deviation =
2
Variance =
192
19.2 4.3
10
2
No _ of _ values
No _ of _ values
=
( x x)
=
192
19.2
10
Introduction to Probability
Permutation:
n
Pr
Combination:
n!
(n r )!
Example:
n
Cr
n!
(n r )! r!
Example:
5
P3
= 60
Example1
One dice is rolled. Find probability
of getting MORE THAN 4.
Sample Space = {1, 2, 3, 4, 5, 6}
Favourite Event = { 5, 6}
1
2
P(getting more than 4) =
or
3
6
Probability
Example3
Two dice are rolled
simultaneousely. Find probability of getting
SUM LESS THAN 4.
Sample Space ={(1,1)(1,2)(1,3)(1,4)(1,5)(1,6)
(2,1)(2,2)(2,3)(2,4)(2,5)(2,6)
(3,1)(3,2)(3,3)(3,4)(3,5)(3,6)
(4,1)(4,2)(4,3)(4,4)(4,5)(4,6)
(5,1)(5,2)(5,3)(5,4)(5,5)(5,6)
(6,1)(6,2)(6,3)(6,4)(6,5)(6,6)}
5
C 3 = 10
Example 2
Two
coins
are
tossed
simultaneousely. Find probability of getting
AT LEAST ONE TAIL.
Sample Space = {HH, HT, TH, TT}
Favurite Event = { HT, TH, TT }
3
P(getting at least one tail) =
4
Example 4
Three
coins
are
tossed
simultaneousely. Find probability of getting
AT LEAST TWO TAILS.
Sample Space = {HHH, HTH, THH, TTH,
HHT, HTT, THT, TTT}
Favurite Event = { TTH, HTT, THT, TTT}
4 1
P(getting at least two tail) = or
8 2
Favourite Event = {(1,1)(1,2)(2,1)}
1
3
P(sum less than 4) =
or
12
36
Home Work
Q1. What is the probability of getting exactly two heads when three balanced coins are
tossed once.
Q2. A pair of fair dice is rolled once. Find the probability that the sum of the faces is 9.
Q3. Three dice are rolled. What is the probability of getting a total of 13.
Q4. The record of a weather station shows that out of the past 250 consecutive
weather forecasts were correct 175 times.
(i)
What is the probability that on a given day it was correct?
(ii)
What is the probability that it was not correct on a given day?
days, its
Q3. A class representative has to be chosen from 18 boys and 12 girls. What is the probability that
(i) class representative is a boy (ii) class representative is a girl.
