Statistical Definitions
advertisement

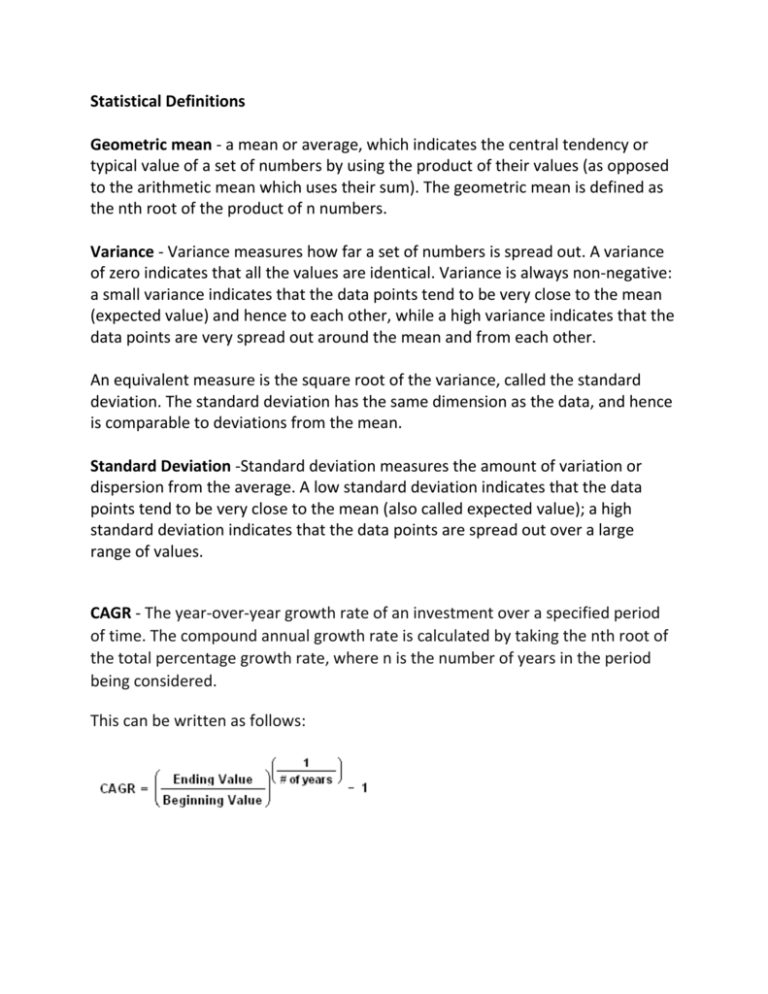
Statistical Definitions Geometric mean - a mean or average, which indicates the central tendency or typical value of a set of numbers by using the product of their values (as opposed to the arithmetic mean which uses their sum). The geometric mean is defined as the nth root of the product of n numbers. Variance - Variance measures how far a set of numbers is spread out. A variance of zero indicates that all the values are identical. Variance is always non-negative: a small variance indicates that the data points tend to be very close to the mean (expected value) and hence to each other, while a high variance indicates that the data points are very spread out around the mean and from each other. An equivalent measure is the square root of the variance, called the standard deviation. The standard deviation has the same dimension as the data, and hence is comparable to deviations from the mean. Standard Deviation -Standard deviation measures the amount of variation or dispersion from the average. A low standard deviation indicates that the data points tend to be very close to the mean (also called expected value); a high standard deviation indicates that the data points are spread out over a large range of values. CAGR - The year-over-year growth rate of an investment over a specified period of time. The compound annual growth rate is calculated by taking the nth root of the total percentage growth rate, where n is the number of years in the period being considered. This can be written as follows:


