Multiwavelength Astronomy: Your World in Different Lights
advertisement
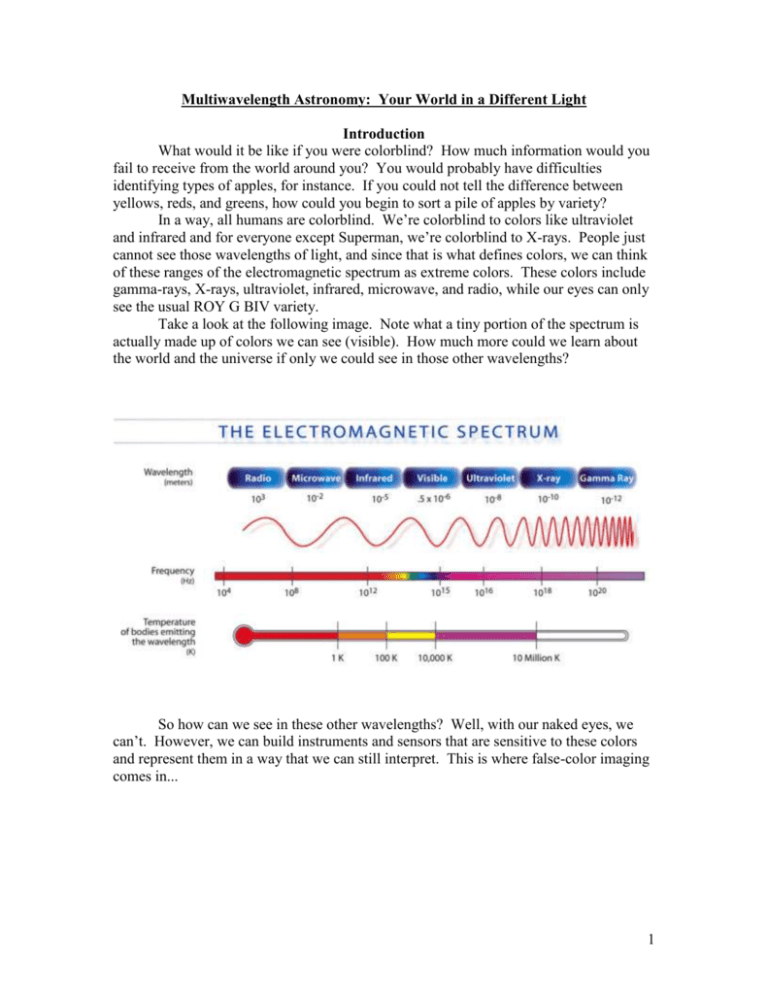
Multiwavelength Astronomy: Your World in a Different Light Introduction What would it be like if you were colorblind? How much information would you fail to receive from the world around you? You would probably have difficulties identifying types of apples, for instance. If you could not tell the difference between yellows, reds, and greens, how could you begin to sort a pile of apples by variety? In a way, all humans are colorblind. We’re colorblind to colors like ultraviolet and infrared and for everyone except Superman, we’re colorblind to X-rays. People just cannot see those wavelengths of light, and since that is what defines colors, we can think of these ranges of the electromagnetic spectrum as extreme colors. These colors include gamma-rays, X-rays, ultraviolet, infrared, microwave, and radio, while our eyes can only see the usual ROY G BIV variety. Take a look at the following image. Note what a tiny portion of the spectrum is actually made up of colors we can see (visible). How much more could we learn about the world and the universe if only we could see in those other wavelengths? So how can we see in these other wavelengths? Well, with our naked eyes, we can’t. However, we can build instruments and sensors that are sensitive to these colors and represent them in a way that we can still interpret. This is where false-color imaging comes in... 1 False Color? Look at the two images on the slide show of a dog that were taken in the infrared. These are two versions of the same image, with the same scale of temperature, but the right picture has a larger range of colors to show the same range in temperature. When there are more colors in the same temperature range, you can easily detect more detail about small temperature differences. Of course, the dog isn’t actually purple. The people who make images using invisible wavelengths, such as infrared, choose the visible colors to represent those wavelengths. They try to make the information useful at a glance, like in these pictures. Which areas on the dog are hottest? __________________________________________ Which are coolest? _______________________________________________________ When you look at a dog in visible light, can you tell which areas are hottest and coolest just by looking? _______________________________________________________________________ X-Ray Challenge Maybe you’re not Superman, but using the right equipment, anyone can see in X-rays. The X-ray wavelength is so small that it only interacts with dense matter on Earth, like metal or bone. If you put an object in between an Xray emitter and an X-ray detector, you can see where the dense materials are located (shown as white in this picture). This picture was taken with the object still sealed, so the X-rays are penetrating through the outer part we would normally see. What do you think this object is? _____________________________________ _____________________________________ What are the bright areas highlighting? _____________________________________ ____________________________________ 2 Wien’s Law Where Do All Of These Different Wavelengths Come From? Right now, every object in the room around you is emitting electromagnetic waves…your shoes, your chair, the wall, even you…Everything is radiating! Anything with any heat energy whatsoever radiates electromagnetic waves. The only way an object could not emit radiation is if its temperature were absolute zero (0 Kelvin, or about -460 Fahrenheit). But the laws of thermodynamics tell us that it impossible for something to get that cold, so you can correctly say that every single object in the entire universe is emitting electromagnetic waves! Some objects are better emitters than others. For example, a light bulb filament will emit radiation much more efficiently than a pencil eraser. Stars happen to be some of the best emitters around; they are very close to being perfect emitters (which physicists call black bodies). Most objects, especially stars, will emit electromagnetic waves in almost every possible wavelength, from gamma rays all the way to radio waves. But each object will emit significantly more radiation in some wavelengths compared to others. The wavelength where an object emits the most radiation is called its wavelength of maximum intensity. The wavelength of maximum intensity doesn’t really depend on what the object is made of…So, what does it depend on? TEMPERATURE! In fact there is a nice, simple law of physics that describes the relationship between the wavelength of maximum intensity and temperature. It’s called Wien’s Law: max (nm) = 3,000,000 (Knm) Temperature (K) nm - nanometers K - Kelvin Look closely at where the peak of each curve is. Do hotter objects give off their maximum radiation at shorter or longer wavelengths? __________________ 3 This graph shows the radiation curves for some temperatures that you can relate to: Where do you think extremely hot young stars (100,000K) emit most of their radiation? (circle one) Ultraviolet Visible Infrared Microwave Radio Have you ever noticed your doctor taking your temperature by pointing an instrument in your ear for a split second? Well, that instrument is an infrared detector that finds your wavelength of maximum intensity and then converts it into your body’s temperature. It is a perfect example of utilizing Wien’s Law. 4 How Does All of This Relate to Galactic Astronomy? When astronomers first started looking at galaxies, they could only see them in the visible wavelengths. From what they saw, they were only able to describe galaxies in the most basic way: large collections of stars, sometimes with a spiral structure. They couldn’t understand much more than that. Now that we have the technology to detect other wavelengths of light, we are finding out all sorts of fascinating information about what galaxies are made of, how they evolve, which parts are the most active, and much more. As we just learned, each wavelength can show us objects that represent specific temperatures. The table below puts it all together: Type Of Radiation Gamma rays Characteristic Temperature more than 108 Kelvin (K) X-rays 106-108 K Ultraviolet 104-106 K Visible 103-104 K Infrared 10-103 K Radio less than 10 K Objects Emitting This Type of Radiation * Pulsars or Neutron Stars * Accretion disks around black holes * Interstellar clouds * Regions of hot, shocked gas * Gas in clusters of galaxies * Neutron stars * Supernova remnants * Stellar corona * Supernova remnants * Very hot stars * Quasars * Stars * Galaxies * Reflection nebulae * Emission nebulae * Cool stars * Star Forming Regions * Interstellar dust warmed by starlight * Planets * Comets * Asteroids * Cosmic Background Radiation * Scattering of free electrons in interstellar plasmas * Cold interstellar medium * Regions near white dwarfs * Regions near neutron stars * Supernova remnants * Dense regions of interstellar space (e.g. near the galactic center) * Cold, dense parts of the interstellar medium concentrated in the spiral arms of galaxies in molecular clouds (often the site of star formation). * Cold molecular clouds Table courtesy of NASA/JPL-Caltech 5 Galaxies in a Different Light: Matching Activity - Student Answer Sheet Instructions: In this activity, you will have three sets of cards with images of galaxies. Each set is comprised of images taken in a certain wavelength. So one set is visible light images, one is ultraviolet images, and the other is radio images. The same eight galaxies are represented in each wavelength. After matching different pairs of images, record your matches in the charts provided. In the last column, describe why you chose to pair each match in the way you did. Be as detailed as possible in your descriptions. Match the set of VISIBLE images with RADIO images. A sample answer has been shown in the chart. Visible 90 Radio Z Reasoning spiral arms extend clockwise, matched features on upper left, same orientation 6 Now put aside the radio images. Match the VISIBLE images with ULTRAVIOLET images. Visible Ultraviolet Reasoning 7 Now match the RADIO images back with the VISIBLE-ULTRAVIOLET pairs so that you have sets of three, where each set is the same galaxy. Visible Ultraviolet Radio Reasoning Now look at the slide show to check your answers and revise your sets. Assessment Challenge Look at the slide: For each numbered picture, guess which wavelength the picture represents, and write three galaxy features that are likely to be seen in that wavelength: Wavelength Galaxy Features Represented 1 2 3 4 5 8 Bonus Challenge Now match the Extended Image Set. This Set has 5 galaxies, each galaxy has a visible image. Each of those visible images will pair with either a radio or ultraviolet image. When you are done, you should have 5 pairs where each pair is the same galaxy. For the wavelength range not represented in a pair, draw a line through that box when recording your answers. Visible Ultraviolet Radio Reasoning To see more awesome pictures like the ones in the slide show, and to find out more about the telescopes involved in capturing them, please visit NASA’s CoolCosmos website: http://coolcosmos.ipac.caltech.edu// 9
