CanineMIAME
advertisement
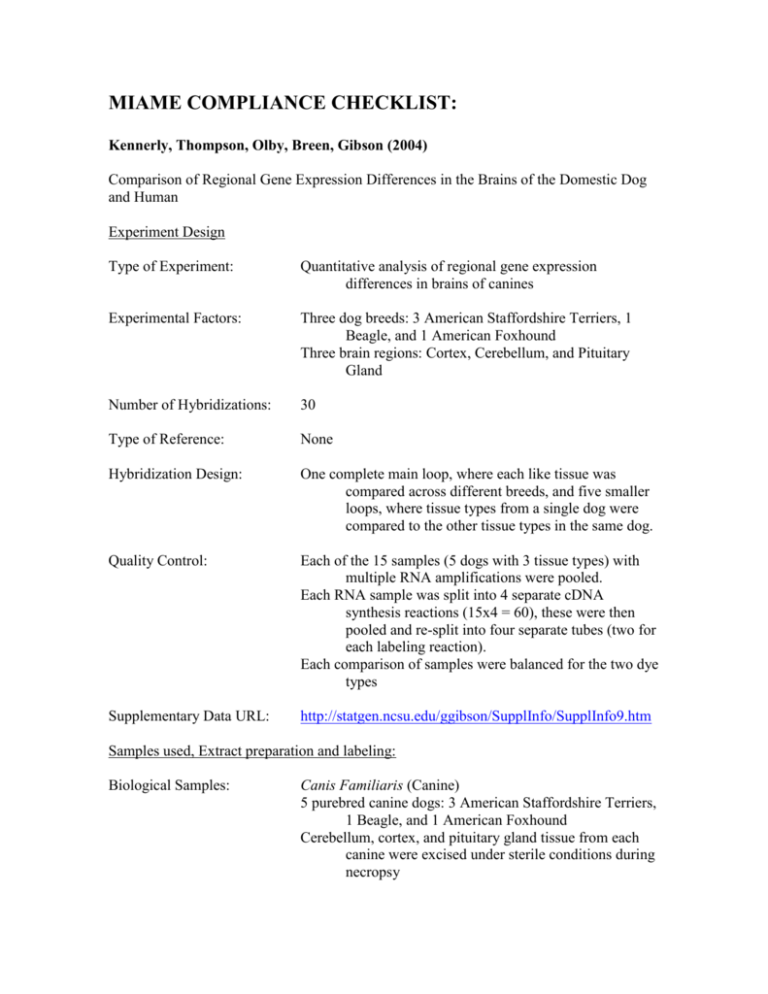
MIAME COMPLIANCE CHECKLIST: Kennerly, Thompson, Olby, Breen, Gibson (2004) Comparison of Regional Gene Expression Differences in the Brains of the Domestic Dog and Human Experiment Design Type of Experiment: Quantitative analysis of regional gene expression differences in brains of canines Experimental Factors: Three dog breeds: 3 American Staffordshire Terriers, 1 Beagle, and 1 American Foxhound Three brain regions: Cortex, Cerebellum, and Pituitary Gland Number of Hybridizations: 30 Type of Reference: None Hybridization Design: One complete main loop, where each like tissue was compared across different breeds, and five smaller loops, where tissue types from a single dog were compared to the other tissue types in the same dog. Quality Control: Each of the 15 samples (5 dogs with 3 tissue types) with multiple RNA amplifications were pooled. Each RNA sample was split into 4 separate cDNA synthesis reactions (15x4 = 60), these were then pooled and re-split into four separate tubes (two for each labeling reaction). Each comparison of samples were balanced for the two dye types Supplementary Data URL: http://statgen.ncsu.edu/ggibson/SupplInfo/SupplInfo9.htm Samples used, Extract preparation and labeling: Biological Samples: Canis Familiaris (Canine) 5 purebred canine dogs: 3 American Staffordshire Terriers, 1 Beagle, and 1 American Foxhound Cerebellum, cortex, and pituitary gland tissue from each canine were excised under sterile conditions during necropsy All dogs submitted to NCSU Veterinary Teaching Hospital for euthanasia and necropsy at owners request Biological Manipulations: All tissues were flash frozen immediately upon removal in liquid nitrogen and stored at –80C RNA was extracted using TRIzol manufactures protocol (Invitrogen), run through Qiagen RNeasy Mini Kit for clean up, and stored at –80C RNA was linear amplified using Agilent Low Input Fluorescent Linear Amplification Kit (5184-3523) *Protocol was modified by only performing a single round of amplification to get amplified complementary RNA Labeling Protocols: Labeled amplified RNA samples with Cy3 or Cy5 using aminoallyl indirect labeling protocol from The Institute for Genomic Research (SOP#M004) External Controls: None Hybridization procedures and parameters: Hybridization protocol: Hybridizations were performed for 20 hours at 42C. All hybridizations were performed between August 6, 2003 and September 20, 2003. Washing Protocol: Washings were performed using a standard series of three high stringency washes Measurement data and specifications: Scanning and software: ScanArray 4000 Microarray Analysis System Scanner (Packard Bioscience). Sixty (two for each array) acquired TIFF images were analyzed using ScanAlyze 2 (http://rana.lbl.gov/Eisensoftware.htm) Data Files: 30 raw data files in text format 1 data file for SAS import with log2 values for each array, with spots at background or below removed Type of Data: Raw fluorescence intensity values with background values subtracted Log base 2 transformations of raw subtracted fluorescence values Data Transformation: Subtracted background average from the spot raw intensity levels for each dye channel Averaged log2 values for each spot across all arrays and removed spots with average value at or below background levels 2 -Step Mixed Model ANOVA: -Step 1: Compute relative fluorescence intensities (RFI), by removing overall dye and array effects -Step 2: Evaluate breed specific effects, tissue specific effects and breed and tissue interaction effects. Volcano plots were used to evaluate the significance of expression against the magnitude of the expression (plotted as negative log p-value against log base 2 value) Two way hierarchical clustering was done to evaluate regional expression in the brain Final Gene Expression Data: Worksheet 1: Selected Gene list with annotations Worksheet 2: Results of Mixed Model ANOVA Worksheet 3: Raw Data file Link: http://statgen.ncsu.edu/ggibson/SupplInfo/SupplInfo9.htm Array Design: General: cDNA arrays printed with a pin and loop printer on amino propyl silane coated slides (Corning Gaps II) UV Crosslinking binds DNA to the slide
