Solutions - Diablo Valley College
Diablo Valley College Your Section: ALL ____ Spring 2010
Business 240 Exam #1 Your Name: SUGGESTED SOLUTION TO PRACTICE TEST
This exam is worth a total of 150 points. Each question is marked for the corresponding number of points and minutes. Show all of your work in answering all questions and parts. To gain credit in each question you must explain your answer—you must show your reasoning. Your answer should fit in the allocated space.
You may attach one sheet to this exam if you need extra space for your responses.
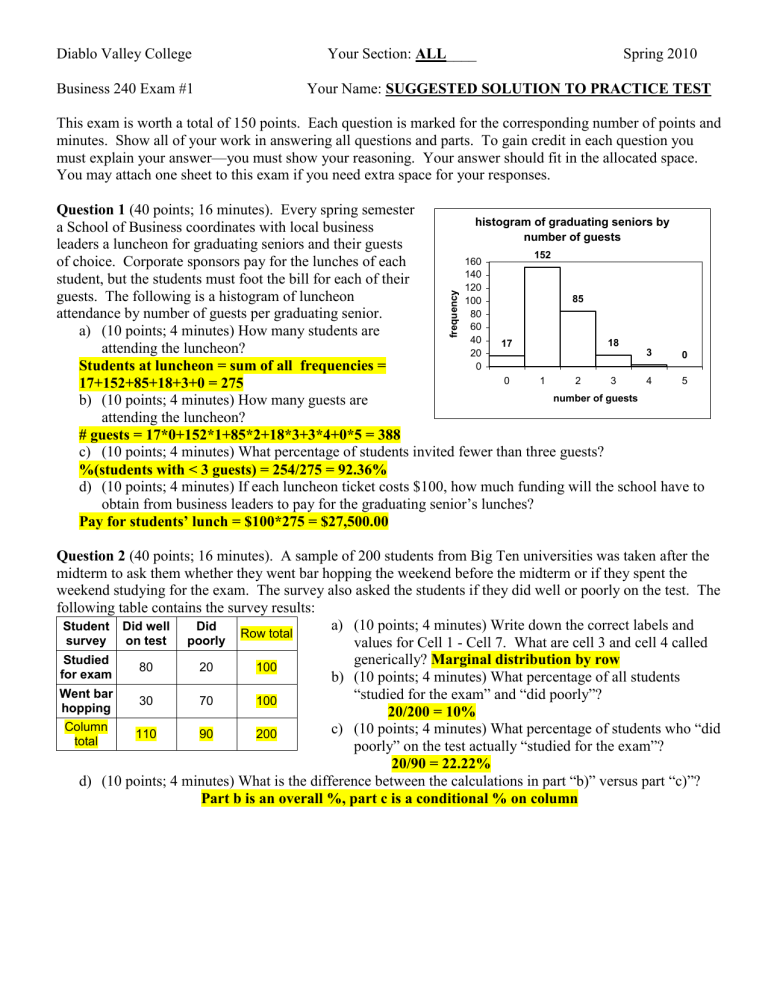
Question 1 (40 points; 16 minutes). Every spring semester a School of Business coordinates with local business leaders a luncheon for graduating seniors and their guests of choice. Corporate sponsors pay for the lunches of each student, but the students must foot the bill for each of their guests. The following is a histogram of luncheon attendance by number of guests per graduating senior. a) (10 points; 4 minutes) How many students are attending the luncheon?
Students at luncheon = sum of all frequencies =
17+152+85+18+3+0 = 275 b) (10 points; 4 minutes) How many guests are attending the luncheon?
160
140
120
100
80
60
40
20
0 histogram of graduating seniors by number of guests
17
0
152
1
85
2
18
3 number of guests
3
4
0
5
# guests = 17*0+152*1+85*2+18*3+3*4+0*5 = 388 c) (10 points; 4 minutes) What percentage of students invited fewer than three guests?
%(students with < 3 guests) = 254/275 = 92.36% d) (10 points; 4 minutes) If each luncheon ticket costs $100, how much funding will the school have to obtain from business leaders to pay for the graduating senior’s lunches?
Pay for students’ lunch = $100*275 = $27,500.00
Question 2 (40 points; 16 minutes). A sample of 200 students from Big Ten universities was taken after the midterm to ask them whether they went bar hopping the weekend before the midterm or if they spent the weekend studying for the exam. The survey also asked the students if they did well or poorly on the test. The following table contains the survey results:
Student survey
Did well on test
Did poorly
Row total a) (10 points; 4 minutes) Write down the correct labels and values for Cell 1 - Cell 7. What are cell 3 and cell 4 called
Studied for exam
Went bar hopping
Column total
80
30
110
20
70
90
100
100
200 generically? Marginal distribution by row b) (10 points; 4 minutes) What percentage of all students
“studied for the exam” and “did poorly”?
20/200 = 10% c) (10 points; 4 minutes) What percentage of students who “did poorly” on the test actually “studied for the exam”?
20/90 = 22.22% d) (10 points; 4 minutes) What is the difference between the calculations in part “b)” versus part “c)”?
Part b is an overall %, part c is a conditional % on column
Question 3 (40 points; 16 minutes). The data below represent the amount (in grams) of carbohydrates in a serving of breakfast cereal in a sample of 11 servings: 11 15 23 29 19 22 21 20 15 25 17. The following statistics come from this data set:
Statistic a) (10 points; 4 minutes) How many grams of carbohydrates does a serving of breakfast cereal have—identify the center and spread in grams per serving? Center: approx. 20 gm. Spread: approx. 5 to 8
Mean
Median
Variance
19.73
20.00
26.02 gm.
b) (10 points; 4 minutes) If we were to graph the histogram of carbohydrate amount (in grams), what shape would it have?
Standard Deviation 5.10 Shape: slightly skewed left b/c mean < median
Coefficient of Var. 25.86%
Range 18.00
Inter-quartile Range 8.00 c) (10 points; 4 minutes) Sketch the Box-plot for this data—based on the five number summary—maintaining scale proportions, to confirm
Q1 15.00 the shape is as in part (b). to be covered in ch. 6
Q3 23.00
Min 11.00
Max 29.00 d) (10 points; 4 minutes) Calculate the standard score (z-score) for the cereal with the highest carbohydrate content in the data (29) and describe the meaning of your answer—interpret the value of the Z score.
Z(29) = (29-19.73)/5.1 = 1.82 … the largest data value is 1.82 standard deviations greater than the mean (middle value).
Question 4 (30 points; 12 minutes)
As research for an ecology class, DVC students collect data on local streams each year. They record a number of biological, chemical and physical variables including the stream name, the substrate of the stream
(limestone, shale, or mixed), the acidity of the water (pH), the temperature (degree F), and the BCI (numerical index of biologic diversity).
Identify the W’s, name the variables, state whether they are categorical or numerical, and, when numerical, state the units of measurement (if given).
Who: streams; Where: locally; When: annually—years not available; Why: to complete research for a class at DVC; What: biological, chemical and physical variables (Categorical: Stream name, AND substrate of stream) (Numerical: acidity of water (in pH units), temperature (in degrees Fahrenheit),
AND BCI)
