Atmosphere - geographyjacks
advertisement
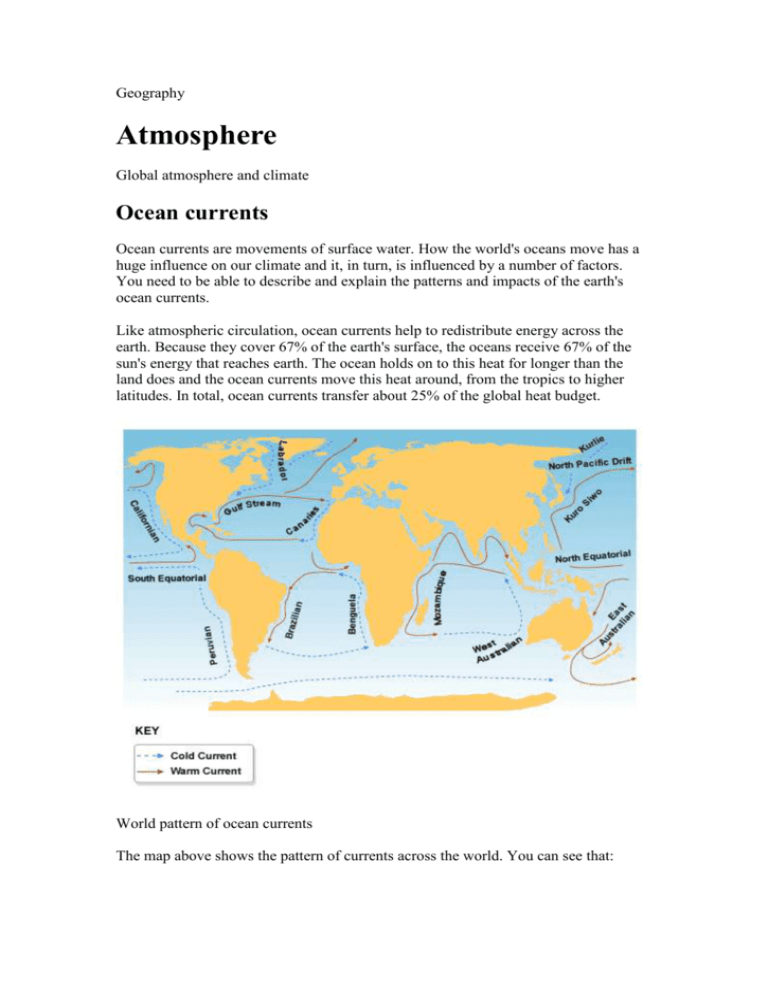
Geography Atmosphere Global atmosphere and climate Ocean currents Ocean currents are movements of surface water. How the world's oceans move has a huge influence on our climate and it, in turn, is influenced by a number of factors. You need to be able to describe and explain the patterns and impacts of the earth's ocean currents. Like atmospheric circulation, ocean currents help to redistribute energy across the earth. Because they cover 67% of the earth's surface, the oceans receive 67% of the sun's energy that reaches earth. The ocean holds on to this heat for longer than the land does and the ocean currents move this heat around, from the tropics to higher latitudes. In total, ocean currents transfer about 25% of the global heat budget. World pattern of ocean currents The map above shows the pattern of currents across the world. You can see that: the currents set up circular loops or gyresgyres: spiral oceanic surface currents. in both the northern and southern hemispheres the pattern of current flow is clockwise in the northern hemisphere and anticlockwise in the southern hemisphere in the Atlantic and Pacific oceans, the currents make a similar pattern Ocean currents flowing away from the equator are called warm currents. The water in these currents is not necessarily warm, but it's warm compared to what you would expect for that latitude. The Gulf Stream is a good example of a warm current. If a current flows towards the equator it is a cold current, for example the Canaries current. These patterns can be explained by a number of factors: The prevailing winds on the surface create friction with the surface water, setting up the ocean currents. The huge size of the Atlantic and Pacific oceans allows these patterns to form. The trade winds drive the pattern between 0 and 30 degrees north and south and the westerlies create the pattern between 30 and 60 degrees north and south. Ocean currents don't flow due north or due south because of the coriolis force caused by the earth's rotation. This deflects the currents to the right in the northern hemisphere and to the left in the southern hemisphere. Uneven heating produces density differences in the oceans. Cold dense polar water sinks, then spreads towards the equator where it pushes up the less dense warmer water which moves off towards the polar areas. Global warming The diagram below shows variations in global temperature over the past 100 years. Note that the y-axis shows the difference in degrees Celsius from the 1900 mean (average) temperature. Global mean surface temperature 1900-2000 You may be asked to describe what a line graph like this shows. Broadly, this graph shows that the overall trend is a rise in global surface temperature from 1900 to 2000. In more detail it shows: there was a drop in mean (average) temperature of 0.1 degree in the first 10 years of the 20th century the temperature then increased, reaching 0.3 degrees above the 1900 mean by 1940 the average temperature then dropped back to 0.2 degrees above the 1900 figure by 1950 and fluctuated around that figure until 1975 in the past 25 years of the century the temperature rose rapidly to 0.7 degrees higher than 1900 by the year 2000 Remember that the gradient of this line graph shows how quickly or slowly the temperature is changing - the steeper the slope, the faster the change. The temperature varied due to a combination of physical and human factors. Physical causes Physical causes of global warming and cooling include: variations in solar energy - sunspot activity raises global temperature volcanic eruptions - large quantities of volcanic dust in the atmosphereatmosphere: The Earth's atmosphere is the envelope of gasses that surround the earth. The gasses are held there by the Earth's gravity. The important gasses in the atmosphere are nitrogen, oxygen and carbon dioxide. shield the earth from incoming insolationinsolation: solar radiation received in the Earth's atmosphere or at its surface., lowering global temperature. For example, the eruption of Mount Pinatubo in 1991 caused a dip in global temperatures in the early 1990s Milankovitch cycles or variations in the tilt and/or orbit of the earth around the sun changing oceanic circulation such as the periodic warming (El Nino) and cooling (La Nina) of areas of the tropical Pacific Ocean These physical causes of global temperature change have always existed and have been responsible for alternate heating and cooling cycles of the earth's temperature. Human causes The human causes of global warming have been in the news a lot in recent years - you can probably think of a few examples. Human factors are the result of growing population and economic developments. They include: the burning of fossil fuels for transport, industry and power, producing carbon dioxide world-wide deforestation, sometimes involving rainforest burning, which also produces carbon dioxide car exhausts and nitrogen fertilisers, producing nitrous oxide CFCs found in fridges, air conditioning and aerosols and as a biproduct of the production of polystyrene packaging, like pizza and burger boxes methane, produced from rice fields, landfill sites and from both ends of cattle These different greenhouse gasesgreenhouse gases: The main greenhouse gases in the atmosphere are carbon dioxide, methane and nitrous oxide. They are naturally occurring in atmosphere, but are believed to have increased through burning more oil, petrol, and coal, while forests have been removed. - carbon dioxide, methane, nitrous oxide - have caused an enhanced greenhouse effectgreenhouse effect: The build up of greenhouse gases, such as Carbon Dioxide [CO2], in the atmosphere, is believed retain more heat in the atmosphere than would usually be the case. Naturally more of the radiation (heat) from the sun would be reflected back into space., trapping some outgoing infra-red radiation and keeping the earth warmer than it might otherwise be. Collectively, these physical and human causes have produced the pattern seen in the graph above. Earth's energy balance The two main features of the earth's energy balance are that: there is a net gain of solar energy in the tropical latitudes and a net loss towards the poles tropical latitudes receive more of the sun's energy than polar regions Input into the global heat budget comes in the form of short-wave solar energy. This is called insolationinsolation: solar radiation received in the Earth's atmosphere or at its surface.. Only 51% of this insolation reaches and is absorbed by the earth's surface. The rest is absorbed by water vapour, dust and clouds, or is reflected by the earth's surface and scattered by particles in the air (the albedoalbedo: the albedo of an object is the extent to which it diffusely reflects light from the sun. effect). The atmosphere is largely heated from below, by long-wave terrestrial radiation from the earth's surface. Latitude and energy balance You can see that there is a surplus of energy between 35N and 35S. In this region, incoming insolation exceeds outgoing radiation. There's an energy deficit between 35N and the north pole, and between 35S and the south pole. Here the outgoing radiation exceeds incoming insolation. Insolation rises sharply from 50 joules at the poles to 275 joules at the equator. Terrestrial radiation varies less, from 120 joules at the poles to 200 joules at the equator. Energy is transferred from the low-latitude energy surplus areas to the high-latitude energy deficit areas by atmospheric circulation. If there was no atmospheric circulation, the low latitudes would get hotter and hotter and the high latitudes colder and colder. The diagram tells us that tropical areas get more insolation than polar regions. Why? At tropical latitudes: the sun's rays are more concentrated, as the noonday sun is high in the sky throughout the year the sun's rays have less atmosphere to pass through, so less energy is lost through absorption and reflection by the atmosphere in tropical rainforest areas, dense vegetation absorbs radiation giving a low relative albedo effect. At high latitudes: the sun's angle is much lower, so the rays of energy are spread out over a much larger area and are therefore less intense because of the earth's curvature, our planet's surface slopes further away from the sun, making heating less intense in polar regions, snow and ice cover reflect much more of the solar radiation, giving a high albedo effect
