Tables
advertisement
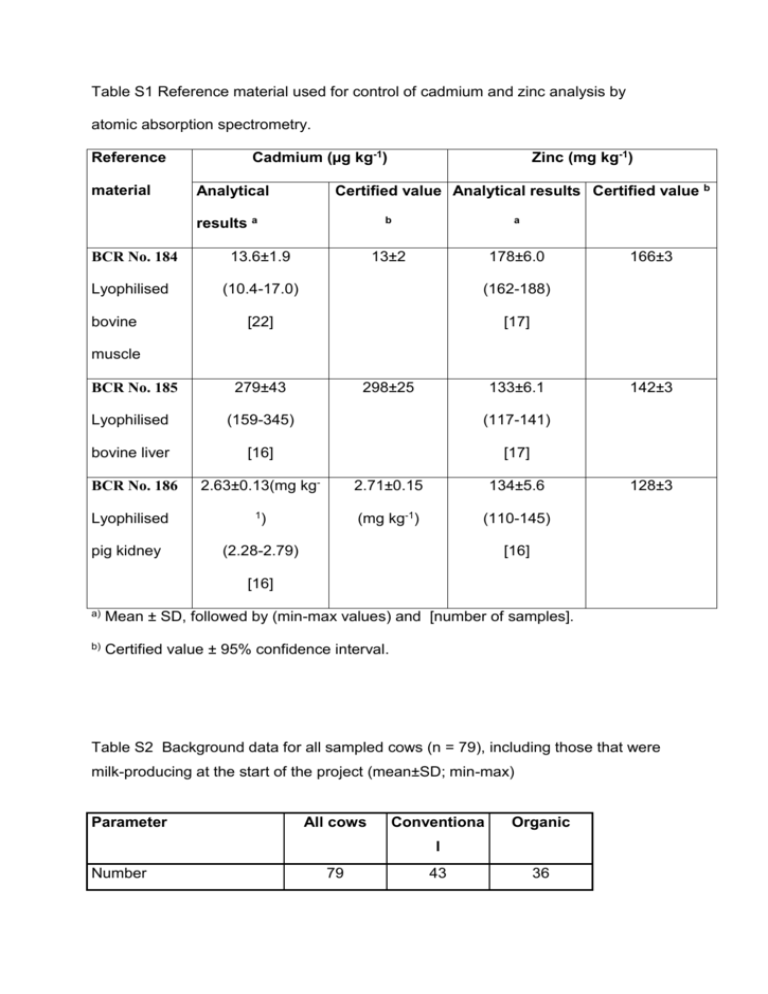
Table S1 Reference material used for control of cadmium and zinc analysis by atomic absorption spectrometry. Reference material Cadmium (µg kg-1) Zinc (mg kg-1) Certified value Analytical results Certified value b Analytical results a b a 13±2 178±6.0 BCR No. 184 13.6±1.9 Lyophilised (10.4-17.0) (162-188) [22] [17] bovine 166±3 muscle BCR No. 185 279±43 Lyophilised (159-345) (117-141) bovine liver [16] [17] BCR No. 186 2.63±0.13(mg kg- 2.71±0.15 134±5.6 1) (mg kg-1) (110-145) Lyophilised pig kidney 298±25 133±6.1 (2.28-2.79) 142±3 128±3 [16] [16] a) Mean ± SD, followed by (min-max values) and [number of samples]. b) Certified value ± 95% confidence interval. Table S2 Background data for all sampled cows (n = 79), including those that were milk-producing at the start of the project (mean±SD; min-max) Parameter All cows Conventiona Organic l Number 79 43 36 Age (months) Age at first calving (months) 62±21 62±22 63±20 (30–126) (31-126) (30-122) 27±1.9 27±1.9 27±1.9 (24.4–32.8) (24-33) (24-32) 99±94 97±88 101±102 (0–415) (0-376) (0-415) 2.8±1.7 2.8±1.7 2.8±1.7 (1–8) (1-8) (1-8) 370±160 350±170 390±150 (3–855) (3-677) (144-855) 21330±1314 21140±1374 21560±1258 0 0 0 Days as dry cow No. of calves Days since calving Total milk production (kg) ECMa (kg) (970-59800) (970-59800) (2390-52450) 23260±1436 23040±1519 23530±1350 0 0 0 (1030– (1030-65960) (2580-55460) 65960) Months in productionb Production index (kg ECM/months in 32±19 32±20 33±17 (4.2-90) (4.2-90) (5.2-82) 700±140 700±160 690±110 (135–993) (135-993) (405-869) production) a) Energy corrected milk (ECM)23 is the milk production converted to milk with an energy value of 3.14 MJ kg-1, calculated as ECM (kg) = 0.25 kg Milk + 12.2 kg Fat + 7.7 kg Protein b) Months in production = Age – [Age at first calving + (Days as dry cow/30)] Table S3 Cadmium and zinc concentrations in kidney, liver, muscle and mammary tissue, mean±SD, (min-max) and [number of individuals] on a wet weight (WW) basis in all sampled cows (n = 79), including those that were milk-producing at the start of the project Tissue Element All cows Conventional Organic Kidney Liver Muscle Mammary Cd 400±150 420±140 370±150 (µg kg-1) (140-810) (160-780) (140-810) [79] [43] [36] Zn 20±1.9 20±2.0 19±1.4 (mg kg-1) (16-27) (16-27) (17-23) Cd 41±21 43±19 39±23 (µg kg-1) (13-130) (13-89) (14-130) [79] [43] [36] Zn 37±8.8 38±1 36±5.0 (mg kg-1) (27-99) (27-99) (27-46) Cd 0.50±0.15 b 0.51±0.16 0.50±0.13 (µg kg-1) (0.21-1.1) (0.21-1.1) (0.21-0.75) [78] [42] [36] Zn 60±14 57±12 64±16 (mg kg-1) (34-100) (34-84) (34-100) Cd 0.54±0.37 c 0.62±0.44 0.44±0.24 a (µg kg-1) (0.19-2.2) (0.19-2.2) (0.21-1.5) [74] [39] [35] Zn 19±9.6 18±9.0 19±10 (mg kg-1) (8.7-51) (8.7-40) (9.2-51) a) Significantly different (p<0.05, Students’ t-test) from the conventional system. b) 88% of the samples above detection limit. c) 69% of the samples above detection limit.

