Topic for today: Discussion of “variability” and “errors” in measurement
advertisement
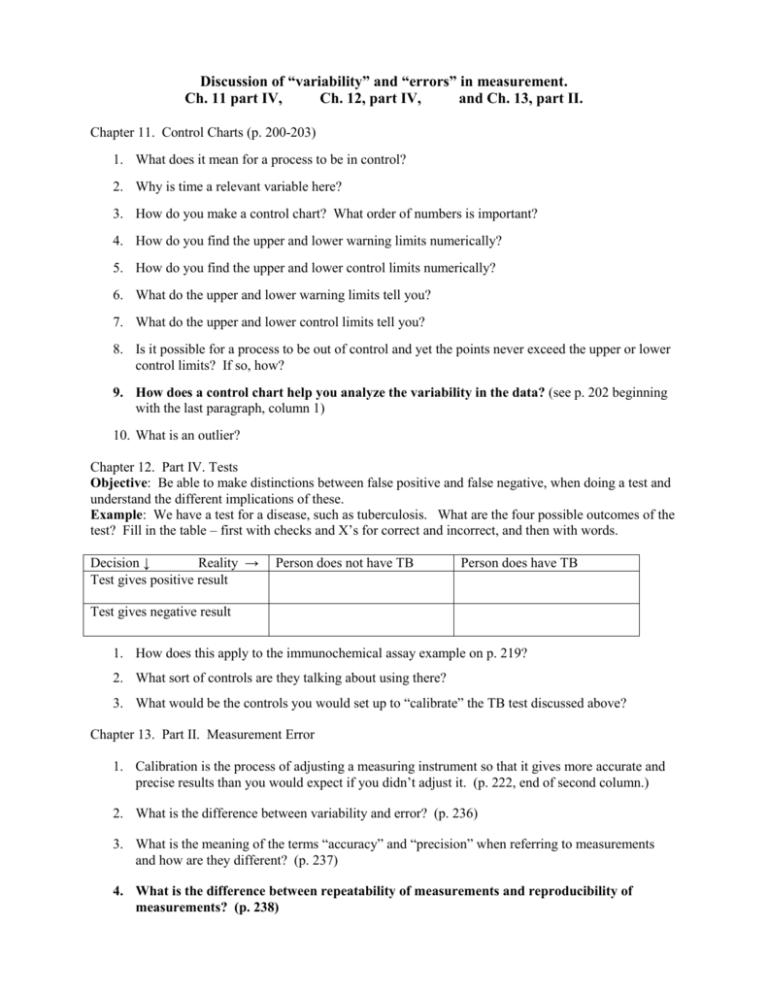
Discussion of “variability” and “errors” in measurement. Ch. 11 part IV, Ch. 12, part IV, and Ch. 13, part II. Chapter 11. Control Charts (p. 200-203) 1. What does it mean for a process to be in control? 2. Why is time a relevant variable here? 3. How do you make a control chart? What order of numbers is important? 4. How do you find the upper and lower warning limits numerically? 5. How do you find the upper and lower control limits numerically? 6. What do the upper and lower warning limits tell you? 7. What do the upper and lower control limits tell you? 8. Is it possible for a process to be out of control and yet the points never exceed the upper or lower control limits? If so, how? 9. How does a control chart help you analyze the variability in the data? (see p. 202 beginning with the last paragraph, column 1) 10. What is an outlier? Chapter 12. Part IV. Tests Objective: Be able to make distinctions between false positive and false negative, when doing a test and understand the different implications of these. Example: We have a test for a disease, such as tuberculosis. What are the four possible outcomes of the test? Fill in the table – first with checks and X’s for correct and incorrect, and then with words. Decision ↓ Reality → Test gives positive result Person does not have TB Person does have TB Test gives negative result 1. How does this apply to the immunochemical assay example on p. 219? 2. What sort of controls are they talking about using there? 3. What would be the controls you would set up to “calibrate” the TB test discussed above? Chapter 13. Part II. Measurement Error 1. Calibration is the process of adjusting a measuring instrument so that it gives more accurate and precise results than you would expect if you didn’t adjust it. (p. 222, end of second column.) 2. What is the difference between variability and error? (p. 236) 3. What is the meaning of the terms “accuracy” and “precision” when referring to measurements and how are they different? (p. 237) 4. What is the difference between repeatability of measurements and reproducibility of measurements? (p. 238) 5. What kinds of errors lead to a loss of precision in measurements? (p. 238-239) 6. What kinds of errors lead to a loss of accuracy in measurements? (p. 238-239) 7. From those two previous questions, discuss the difference in what scientists and technical workers mean when they say that a measurement process is imprecise and when they say that a measurement process is inaccurate? (p. 239) 8. How do you evaluate the precision of a measurement process? (How does that flow from the meaning above?) p. 240 9. How do you evaluate the accuracy of a measurement process? (How does that flow from the meaning above?) p. 241. 10. Is the concept of uncertainty in the measurement more closely related to accuracy or precision? (p. 244) 11. When we use precision as a measurement of the uncertainty in a measurement process, what are we ignoring? (p. 244) 12. We have briefly discussed significant digits earlier in this semester. That is covered in detail at the end of Ch. 13, but we don’t have time in this class to really study this. You will have opportunities to practice this in later science courses. .
