How to read a Topographic Map
advertisement

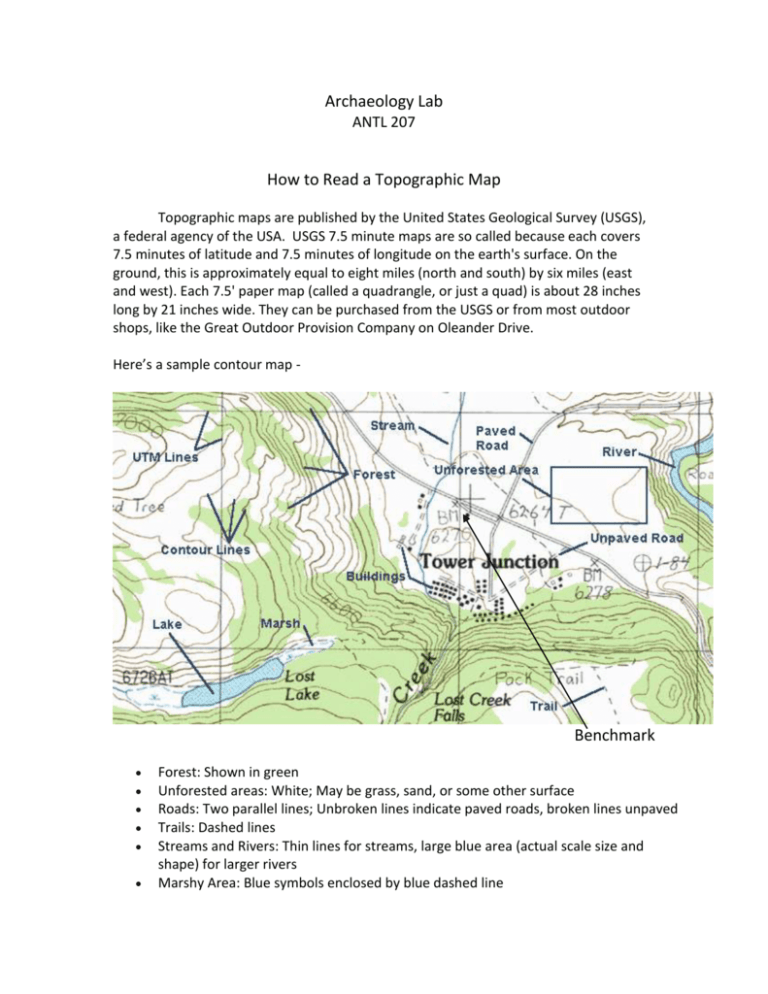
Archaeology Lab ANTL 207 How to Read a Topographic Map Topographic maps are published by the United States Geological Survey (USGS), a federal agency of the USA. USGS 7.5 minute maps are so called because each covers 7.5 minutes of latitude and 7.5 minutes of longitude on the earth's surface. On the ground, this is approximately equal to eight miles (north and south) by six miles (east and west). Each 7.5' paper map (called a quadrangle, or just a quad) is about 28 inches long by 21 inches wide. They can be purchased from the USGS or from most outdoor shops, like the Great Outdoor Provision Company on Oleander Drive. Here’s a sample contour map - Benchmark Forest: Shown in green Unforested areas: White; May be grass, sand, or some other surface Roads: Two parallel lines; Unbroken lines indicate paved roads, broken lines unpaved Trails: Dashed lines Streams and Rivers: Thin lines for streams, large blue area (actual scale size and shape) for larger rivers Marshy Area: Blue symbols enclosed by blue dashed line Buildings: Building shapes shown, may be filled or unfilled UTM Grid Lines: Especially useful for GPS, each grid square is 1 km x 1 km What’s a benchmark? A specific locus whose precise vertical and horizontal location on the Earth’s surface is known. Here’s a shot of a benchmark metal cap I took while walking on The Mall in Washington, D.C. Intro to Contours Contour lines are the continuous brown lines found on topographic maps that give information about elevation. Each line represents a specific elevation, and all locations along that line have the exact same elevation. For example, observe the line indicted by (A) in the map on the next page. If you were to walk along that line on the ground, your elevation would never change. Notice the words "Contour Interval 20 Feet", which are found along the bottom collar of USGS maps. This means that the elevation change between contour lines is 20 feet. The line at (D), for example, has an elevation that is 20 feet below that of (A). It follows, then, that a place on the map with many contour lines together has a large amount of elevation change-- a hillside. The area around (C) is a hillside. Likewise, places like (B) with few contour lines have little elevation change and are flat. You may have noticed that every fifth contour line is darker than the others. The darker contour lines (like (A)) are called Index Contours. If you follow an index line, you will eventually find a place where the elevation of that line is given. (E) is an example of such a place. Another way to find elevations is to use Spot Elevations, like the one shown at (F). These consist of an 'X' next to a number. The number tells the elevation at the location marked by the X. The X indicated by (F) has an elevation of 7,740 feet. There is also another spot elevation on this map. It says '7901T'. Ignore the T, and the elevation there is 7,901 feet. Using Contours to Determine Land Shape How can you tell which side of a hillside is the highest? There are several ways. For the first, look at contour lines (A) and (B) in the map above. Note that (A) is at 7500 ft. and (B) is at 7600 ft. Any line from (A) to (B), then, should be uphill. If you were to travel from east to west on line (C), for example, you would travel uphill. Since the difference between (A) and (B) is 100 feet, there would be exactly 100 vertical feet of elevation gain. A quicker way to find elevation changes is to use creeks and streams. Since water travels downhill, finding the direction that a stream travels can quickly tell you about relief along the length of the watercourse. Fortunately, it is easy to do. Look at the stream indicated by (D) above. Notice that when contour lines run into this stream, they form a 'V' shape that appears to point to the left. On all streams, the V formed by contour lines always points upstream, and therefore uphill. This tells you that the highest point along that hillside is at the left side. Also, check the V shape at point (E). Even though the stream is in a relatively flat area, the upstream-pointing V is still visible. What about the hillside between (H) and (I)? Most larger streams tend to flow at a low point between two high points-- in this case, (I) and (J). From point (H), then, you would be walking uphill if you went east or west. Also, a closed circle like the small one at (I) indicates a high point. Note: The above information is taken from Topo Web’s topo map reading guide at http://www.cis.ksu.edu/~dha5446/topoweb/guide.html


