NAME: Cigarette data for an introduction to multiple regression
advertisement
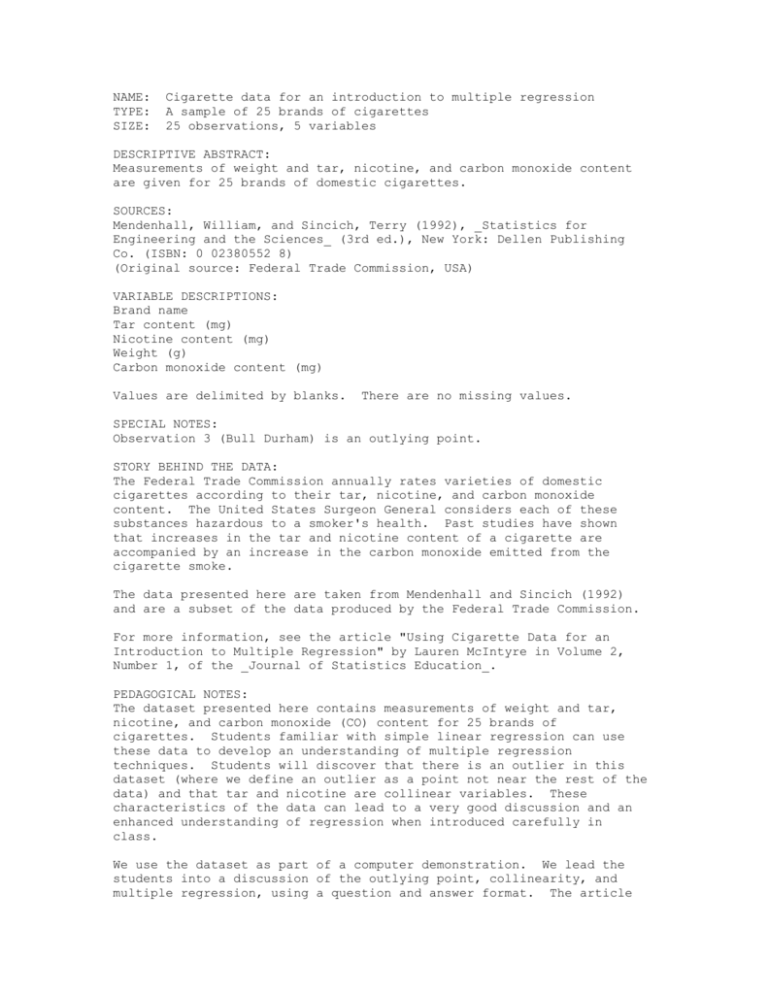
NAME: TYPE: SIZE: Cigarette data for an introduction to multiple regression A sample of 25 brands of cigarettes 25 observations, 5 variables DESCRIPTIVE ABSTRACT: Measurements of weight and tar, nicotine, and carbon monoxide content are given for 25 brands of domestic cigarettes. SOURCES: Mendenhall, William, and Sincich, Terry (1992), _Statistics for Engineering and the Sciences_ (3rd ed.), New York: Dellen Publishing Co. (ISBN: 0 02380552 8) (Original source: Federal Trade Commission, USA) VARIABLE DESCRIPTIONS: Brand name Tar content (mg) Nicotine content (mg) Weight (g) Carbon monoxide content (mg) Values are delimited by blanks. There are no missing values. SPECIAL NOTES: Observation 3 (Bull Durham) is an outlying point. STORY BEHIND THE DATA: The Federal Trade Commission annually rates varieties of domestic cigarettes according to their tar, nicotine, and carbon monoxide content. The United States Surgeon General considers each of these substances hazardous to a smoker's health. Past studies have shown that increases in the tar and nicotine content of a cigarette are accompanied by an increase in the carbon monoxide emitted from the cigarette smoke. The data presented here are taken from Mendenhall and Sincich (1992) and are a subset of the data produced by the Federal Trade Commission. For more information, see the article "Using Cigarette Data for an Introduction to Multiple Regression" by Lauren McIntyre in Volume 2, Number 1, of the _Journal of Statistics Education_. PEDAGOGICAL NOTES: The dataset presented here contains measurements of weight and tar, nicotine, and carbon monoxide (CO) content for 25 brands of cigarettes. Students familiar with simple linear regression can use these data to develop an understanding of multiple regression techniques. Students will discover that there is an outlier in this dataset (where we define an outlier as a point not near the rest of the data) and that tar and nicotine are collinear variables. These characteristics of the data can lead to a very good discussion and an enhanced understanding of regression when introduced carefully in class. We use the dataset as part of a computer demonstration. We lead the students into a discussion of the outlying point, collinearity, and multiple regression, using a question and answer format. The article by Lauren McIntyre presents a summary of the data presentation. SUBMITTED BY: Lauren McIntyre Department of Statistics, Box 8203 North Carolina State University Raleigh, NC 27695-8203 mcintyre@stat.ncsu.edu
