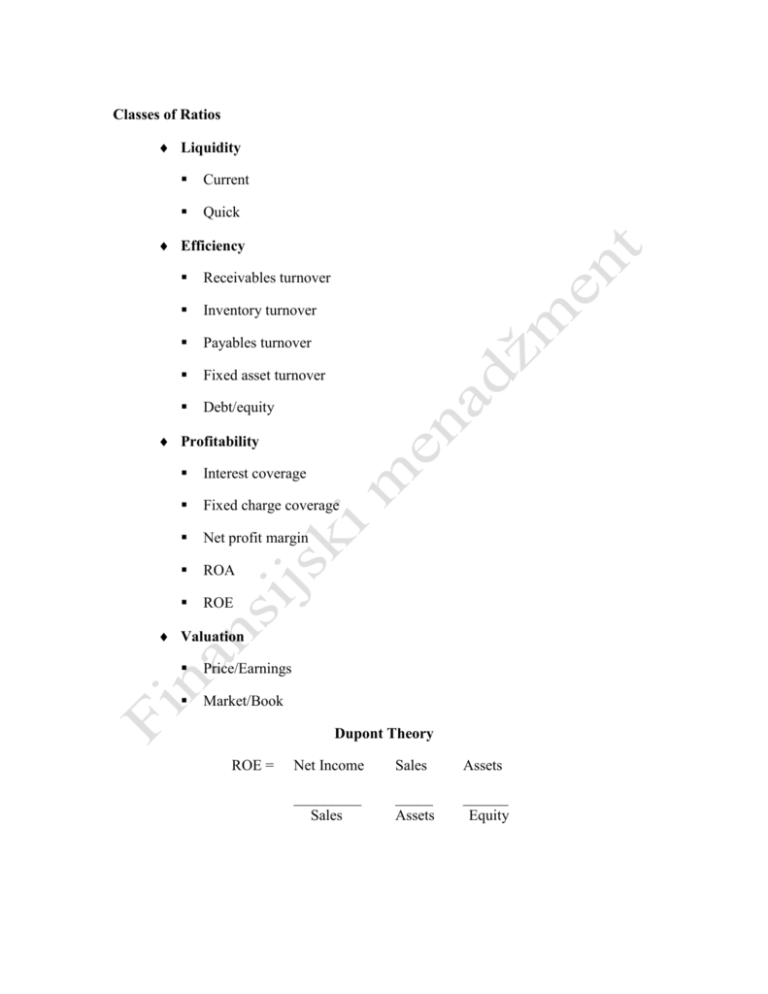
Classes of Ratios
advertisement

Classes of Ratios Liquidity Current Quick Efficiency Receivables turnover Inventory turnover Payables turnover Fixed asset turnover Debt/equity Profitability Interest coverage Fixed charge coverage Net profit margin ROA ROE Valuation Price/Earnings Market/Book Dupont Theory ROE = Net Income Sales Assets _________ Sales _____ Assets ______ Equity KEY FINANCIAL RATIOS Profitability Efficiency Leverage Liquidity KEY FINANCIAL RATIOS . . . PROFITABILITY Ratio Operating Profit Margin Net Profit Margin Calculation (Operating Profit/Net Sales) X 100 (Net Profit/Net Sales) X 100 Definition Represents the percentage of profits retained from each sales dollar Measures the ability of the business to generate profit from each sales dollar Analysis Ratio should remain stable or increase over time Understanding of any changes requires a detailed breakdown of operating expenses In general, this ratio should move in the same direction as the gross and operating profit margins Variances require a closer look at non-operating expenses, e.g., interest expenses Direct Cost & Expense Ratios (Cost of Goods Sold/Net Sales) X 100 Indicates the percentage of each sales dollar used to fund the expenses Upward trends in any of these ratios may indicate reasons for declining profitability Downward trends may indicate good cost control KEY FINANCIAL RATIOS . . . EFFICIENCY Definition of Efficiency: Effectiveness of a company’s management in managing its resources and activities. Ratio Inventory Days on Hand Calculation (Inventory/Cost of Goods Sold) X 360 Days Definition Indicates management’s ability to efficiently manage inventory Low ratio is good Analysis A large increase may indicate a deliberate management decision to make bulk pur-chases in anticipation of a possible supply disruption Interpretation: Division of the inventory turnover ratio into 365 days yields the average length of time units are in inventory. Ratio Accounts Receivable Days on Hand Calculation Definition (Net Accounts Indicates management’s Receivable/Net Sales) X 360 ability to collect its Days receivables Critical to cash flow Analysis Analyze receivable aging schedule and receivable concentrations Poor receivable quality can significantly increase this ratio and greatly impact cash flow Interpretation: This figure expresses the average time in days that receivables are outstanding. Generally, the greater number of days outstanding, the greater the probability of delinquencies in accounts receivable. A comparison of a company’s daily receivables may indicate the extent of a company’s control over credit and collections. The terms offered by a company to its customer, however, may differ from terms within the industry and should be taken into consideration. KEY FINANCIAL RATIOS . . . EFFICIENCY (Cont.) Ratio Accounts Payable Days on Hand Calculation (Accounts Payable/Cost of Goods Sold) X 360 Days Definition Measures financing provided by trade creditors to company and management’s paying habits Analysis Increasing days on hand may indicate cash flow problems In general, a firm with cash flow problems relies more on its trade creditors If A/R days increase significantly, it may indicate a short-term solution to cash flow problems Return on Assets (ROA) Net profit After Taxes/ Total Assets Measures return on investment represented by the assets of the business Analyze as net profit generated by management based upon utilizing the total business assets Return on Equity Net Profit/Tangible Net Worth Measures rate of return on owner’s equity This measures management’s ability to operate a profitable business If the return is good, the company should be able to generate additional equity Interpretation: This ratio measures the number of times accounts and notes payable (trade) turn over during the year. The higher the turnover of payables, the shorter the time between purchase and payment. If a company’s payables appear to be turning more slowly than the industry, then the company may be experiencing cash shortages, disputing invoices with suppliers, enjoying extended terms, or deliberately expanding its trade credit. The ratio comparison of company to industry suggests the existence of these possible causes or others. If a firm buys on 30-day terms, it is reasonable to expect this ratio to turn over in approximately 30 days. A problem with this ratio is that it compares one day’s payables to cost of goods sold and does not take seasonal fluctuations into account. KEY FINANCIAL RATIOS . . . LEVERAGE Definition of Leverage: Compares the funds supplied by business owners with financing supplied by creditors. Measures debt capacity and ability to meet obligations. Ratio Calculation Definition Analysis Debts to Assets Total Liabilities/Total Assets Indicates the degree to which assets are funded by external creditors The lower the ratio, the greater the cushion against creditor losses in the event of liquidation Debt to Net Worth Total Liabilities/Net Worth Measures how many dollars of outside financing there are for each dollar of owners’ equity This ratio indicates firm’s capacity to borrow more High ratio equals high risk Interpretation: This ratio expresses the relationship between capital contributed by creditors and that contributed by owners. It expresses the degree of protection provided by the owners for the creditors. The higher the ratio, the greater the risk being assumed by creditors. A lower ratio generally indicates long-term financial safety. A firm with a low debt/worth ratio usually has greater flexibility to borrow in the future. A more highly leveraged company has a more limited debt capacity. Ratio Interest Coverage Calculation (Net Profit before Tax + Interest Expense)/ Interest Expense Definition Measures the degree to which earnings can decline without affect-ing the company’s ability to meet annual interest costs Analysis This calculation does not include leased assets and obligations under lease contracts Interpretation: This ratio is a measure of a firm’s ability to meet interest payments. A high ratio may indicate that a borrower would have little difficulty in meeting the interest obligations of a loan. This ratio also serves as an indicator of a firm’s capacity to take on additional debt KEY FINANCIAL RATIOS . . . LEVERAGE (Cont.) Ratio Debt Coverage Calculation Definition Net Profit + Depreciation Measures the degree & Amortization/Current to which earnings plus Maturities Long-Term noncash expense can Debt decline without affecting the company’s ability to meet current payments on longterm debt Analysis This calculation does not include leased assets and obligations under lease contracts Interpretation: This ratio expresses the coverage of current maturities by cash flow from operations. Since cash flow is the primary source of debt retirement, this ratio measures the ability of a firm to service principal repayments and is an indicator of additional debt capacity. Although it is misleading to say that all cash flow is available for debt service, the ratio is a valid measure of the ability to service long-term debt. KEY FINANCIAL RATIOS . . . LIQUIDITY Definition of Leverage: The ability of the company’s management to meet current obligations. Ratio Current Ratio Calculation Current Assets/Current Liabilities Definition Current assets available to pay current obligations Analysis Must be aware of A/R and inventory quality; if either is poor, this measure can be misleading. Calculated as of a given date, one day later ratio may change drastically. Interpretation: This ratio is a rough indication of a firm’s ability to service its current obligations. Generally, the higher the current ratio, the greater the “cushion” between current obligations and a firm’s ability to pay them. The stronger ratio reflects a numerical superiority of current assets over current liabilities. However, the composition and quality of current assets is a critical factor in the analysis of an individual firm’s liquidity. Ratio Quick Ratio Calculation Cash + Marketable Securities + Net A/Rs/ Current Liabilities Definition A more accurate measure of current liquid assets available to pay current obligations Analysis Same analysis applies as above, but the quality of marketable securities must be assessed Interpretation: Also known as the “Acid Test” ratio, it is a refinement of the current ratio and is a conservative measure of liquidity. The ratio expresses the degree to which a company’s current liabilities are covered by the most liquid current assets. Generally, any value of less than 1 to 1 implies a strong “dependency” on inventory or other current assets to liquidate short-term debt CASH FLOW—DIRECT METHOD Sales—Net (Inc) Dec in Receivables Cash from Sales Cost of Goods Sold* (Inc) Dec in Inventories Inc (Dec) in Payables Cash Production Costs Gross Cash Margin Selling,General & Administrative Expense* (Inc) Dec in Prepaids Inc (Dec) in Accruals (Inc) Dec Other Assets Cash Operating Expense Cash from Operations Miscellaneous Cash Income** Income Taxes Paid*** Net Cash from Operations Interest Expense Dividends Paid/Owner Withdrawals Financing Costs Net Cash Income Current Portion Long-Term Debt**** Cash after Debt Amortization Capital Expenditures Long-Term Investments Inc (Dec) Other Liabilities Financial Surplus (Requirements) Inc (Dec) Short-Term Debt Inc (Dec) Long-Term Debt Inc (Dec) Equity***** Total External Financing Cash after Financing Actual Change in Cash ( ) Inc Dec Decline in cash Increase Decrease * ** *** **** ***** 19 ______ ________ ________ ________ ________ ________ ________ ________ ________ ________ ________ ________ ________ ________ ________ ________ ________ ________ ________ ________ ________ ________ ________ ________ ________ ________ ________ ________ ________ ________ ________ 19 _______ 19 _____ _________ _______ _________ _______ _________ _______ _________ _______ _________ _______ _________ _______ _________ _______ _________ _______ _________ _______ _________ _______ _________ _______ _________ _______ _________ _______ _________ _______ _________ _______ _________ _______ _________ _______ _________ _______ _________ _______ _________ _______ _________ _______ _________ _______ _________ _______ _________ _______ _________ _______ _________ _______ _________ _______ _________ _______ _________ _______ _________ _______ ________ _________ _______ ________ ________ _________ _________ _______ _______ Net of depreciation Other income—other expense ± change other current assets/liabilities Tax provision ± change in tax refund receivable, income taxes payable and deferred taxes payable Previous year’s current maturities long-term debt Common, preferred, treasury stock only The Direct Cash Flow Statement: Construction Steps To construct the direct cash flow statement, follow these steps: Calculate Cash from Sales. Adjust net sales for the change in accounts receivable. If accounts receivable increase from one year to the next, this is a use of cash. Subtract the amount of increase from net sales. If receivables decrease, this is a source of cash: add the amount of decrease to sales. Calculate Cash Production Costs. Adjust cost of goods sold for the changes in inventory and accounts payable. If inventory increases from one year to the next, this is a use of cash. If inventory decreases from one year to the next, this is a source of cash. If accounts payable increase from one year to the next, this is a source of cash. If accounts payable decrease from one year to the next, this is a use of cash. NOTE: If depreciation is included in cost of goods sold, make the adjustment for the requisite amount. If depreciation has already been separated out from cost of goods sold in the income statement presentation, such an adjustment to cost of goods sold is not necessary. Calculate Gross Cash Profits. Subtract cash production costs from cash from sales. Calculate Cash Operating Expenses. Take operating expenses from the income statement and, if not already included in Cost of Goods Sold, make the same adjustment for depreciation. Now adjust for changes in prepaid expenses and accrued expenses. If prepaid expenses increase from one year to the next, this is a use of cash. If prepaid expenses decrease from one year to the next, this is a source of cash, and operating expenses should be adjusted accordingly. If accrued expenses increase from one year to the next, this is a source of cash. If, on the other hand, they decrease, this is a use of cash. Calculate Cash from Operations. Subtract cash operating expenses from gross cash profits. Calculate Miscellaneous Cash Income/Expense. Take miscellaneous income, minus any miscellaneous expenses. Adjust this by any changes in miscellaneous items in the balance sheet. These may include such items as Other Current Assets, Other Assets, Other Current Liabilities, or Other Long- Term Liabilities. Increases in assets and decreases in liabilities are uses of cash, and are therefore subtracted from miscellaneous income. Decreases in assets and increases in liabilities, on the other hand, are sources of cash and are therefore added to miscellaneous income. Calculate and Subtract Income Taxes Paid. Adjust income taxes shown on the income statement, for changes in taxes payable and deferred taxes on the balance sheet. If taxes payable increase, this is a source of cash and the income statement should be adjusted accordingly. If taxes payable decrease, this is a use of cash. Similarly, if deferred taxes increase, this is a source of cash, and if they decrease, this is a use of cash. Calculate Net Cash After Operations. Subtract miscellaneous cash income (if it is a negative number – add it back if positive) and taxes paid from Cash from Operations. Calculate and Subtract Financing Costs. Take interest expense and subtract from Net Cash from Operations. Also take dividends shown on the income statement and adjust for changes in dividends payable on the Balance Sheet – a source, and therefore an add-back if it is an increase, or a use, and therefore a subtraction, if it declines. Calculate Net Cash Income. Subtract financing costs from Net Cash from Operations to obtain Net Cash Income. Calculate Scheduled Principal Payments on Long-Term Debt. Take current Maturities of Long-Term Debt from the preceding year’s balance sheet and subtract from net cash income. Calculate Cash after Debt Amortization. Subtract current maturities of long-term debt from Net Cash Income. Calculate Fixed-Asset/Capital Expenditures. Take the change in Net Fixed Assets from one year to the next, and add it to the annual depreciation charge (derived from Cost of Goods Sold or Operating Expenses). Calculate the Change in Intangibles and/or Long-Term Investments. If the change in this item is an increase, this will be a use of cash. If it is a decrease, it will be a source of cash. Calculate the Financing Requirement/Surplus. Subtract capital expenditures and change in Intangibles and/or Long-Term Investments from Cash after Debt Amortization. Calculate Changes in Financing (Short- and Long-Term Debt and Equity). Calculate Change in Short-Term Debt. If Short-Term Debt has increased from one year to the next, this is a source of cash. If it has decreased, this is a use of cash. Determine the Change in Long-Term Debt. Subtract Long-Term Debt only, at the end of the preceding year, from Long-Term Debt plus Current Maturities of Long-Term Debt at the end of the year under review. Calculate Change in Equity. If Common Stock from one year to the next has increased, this is a source of cash. If it has decreased, this will be a use of cash. Do not adjust for the change in Retained Earnings, since this has already been factored into the Cash Flow Statement. Calculate Total External Financing. Total the changes in Short-Term Debt, Long-Term Debt, and Equity. Calculate the Change in Cash. Subtract Total External Financing from the Total Financing Requirement. Proceed to calculate the change in Cash. The two items should reconcile. If total external financing exceeds the total financing requirement, this will result in a corresponding increase in Cash. If the total external financing is less than the total financing requirement, this should result in a corresponding reduction in Cash. Case Study: Sareno Enterprises Using the direct cash flow format, complete the 1997 and 1998 cash flow for Sareno. CASH FLOW DRIVERS Gross margin Selling/general/administrative expenses Account receivables days Inventory days Accounts payable days Sales growth Cost of goods sold growth for inventory Cost of goods sold growth for accounts payable


