Biome Temperature & Precipitation Worksheet Activity
advertisement
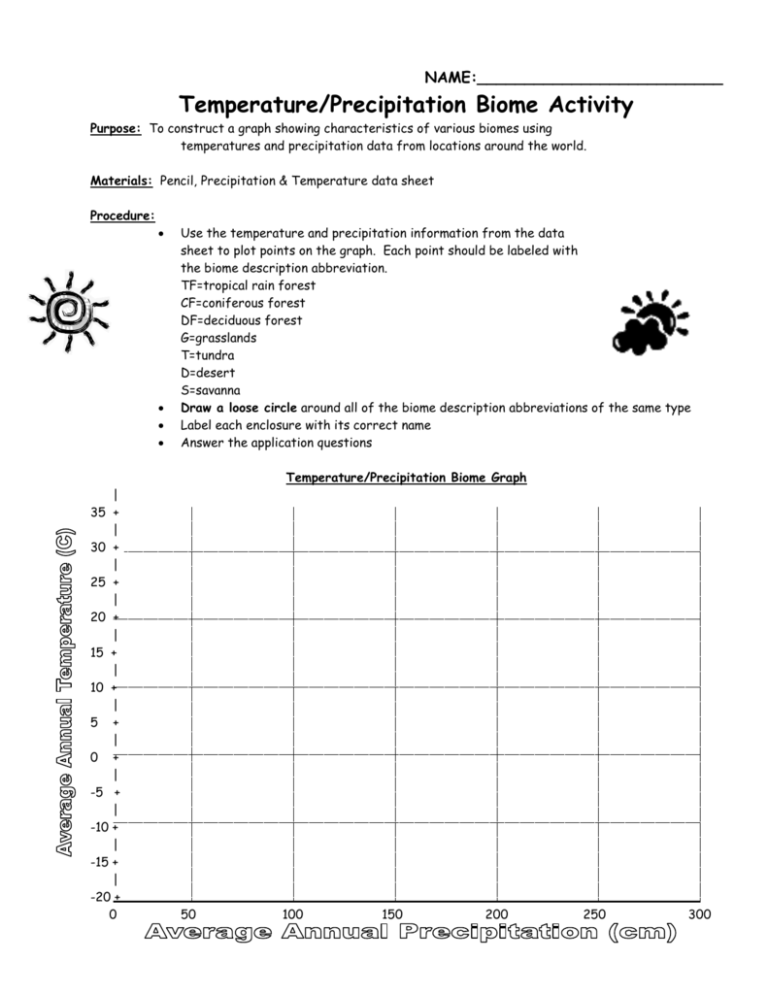
NAME:__________________________ Temperature/Precipitation Biome Activity Purpose: To construct a graph showing characteristics of various biomes using temperatures and precipitation data from locations around the world. Materials: Pencil, Precipitation & Temperature data sheet Procedure: Use the temperature and precipitation information from the data sheet to plot points on the graph. Each point should be labeled with the biome description abbreviation. TF=tropical rain forest CF=coniferous forest DF=deciduous forest G=grasslands T=tundra D=desert S=savanna Draw a loose circle around all of the biome description abbreviations of the same type Label each enclosure with its correct name Answer the application questions Temperature/Precipitation Biome Graph | 35 + | 30 + | 25 + | 20 + | 15 + | 10 + | 5 + | 0 + | -5 + | -10 + | -15 + | -20 + 0 50 100 150 200 250 300 Application Questions: 1. Which of the biomes has the broadest set of characteristics? ______________________How do you know? Which of the biomes has the smallest set of characteristics?_______________________ How do you know? 2. What seems to be the major difference between a deciduous forest and a coniferous forest? 3. What makes it possible for a country (the US for example) to have more than one type of biome within its borders? 4. The lower right hand side of your graph seems to be void of biomes. What reason for this occurrence can you give? Explain. 5. Prickly Pete wants to start a cactus grove in Oregon, where the average temperature is 10C and the average precipitation in 150cm. Would you be willing to invest in this venture? ________________________Why? What type of plant would be more suited to this location?____________________________________________________ 6. What might happen to a coniferous forest and a deciduous forest which reside next to each other on a mountain slope if the average temperature in that locale were to rise 10 degrees C? 7. What does figure A describe happens to vegetation as precipitation decreases? 8. Using figure B describe the relationship of precipitation and temperature. Precipitation & Temperature data sheet Location Mongolia Bolivia Chile Mexico Nevada Alaska Canada Egypt Greenland Florida Cuba Kansas Russia Canada Japan Africa Australia Michigan India Alps Alberta Iceland England France Kuwait China China Russia Peru Oregon Baja Panama New Zealand Texas Ontario Norway Argentina South Africa New York Pakistan Australia Russia California Turkey Canada North Dakota South Dakota Morocco Russia Georgia Sweden Germany Quebec Spain Libya Biome Precipitation Abbreviation (cm) CF TF D TF D T T D T DF TF G CF CF DF S D DF TF T G T DF DF D S D T DF DF D TF TF G CF CF S D DF TF S CF DF G CF G G G G DF CF DF CF S D 200 257 10 210 13 15 12 12 35 156 295 40 170 165 159 160 10 110 250 20 35 20 150 105 5 95 2 10 60 170 4 295 205 40 80 109 200 25 140 210 90 45 80 20 90 40 40 14 6 125 198 54 103 140 2 Temperature (C) 5 30 10 28 25 -12 -9 30 -10 17 29 20 -6 9 20 28 18 15 19 -12 0 -15 15 14 19 28 5 -17 15 14 31 15 15 28 -13 -15 22 23 20 20 20 -6 16 15 0 10 15 15 -5 21 10 5 -5 25 28
