DOI: 10 - Nature
advertisement
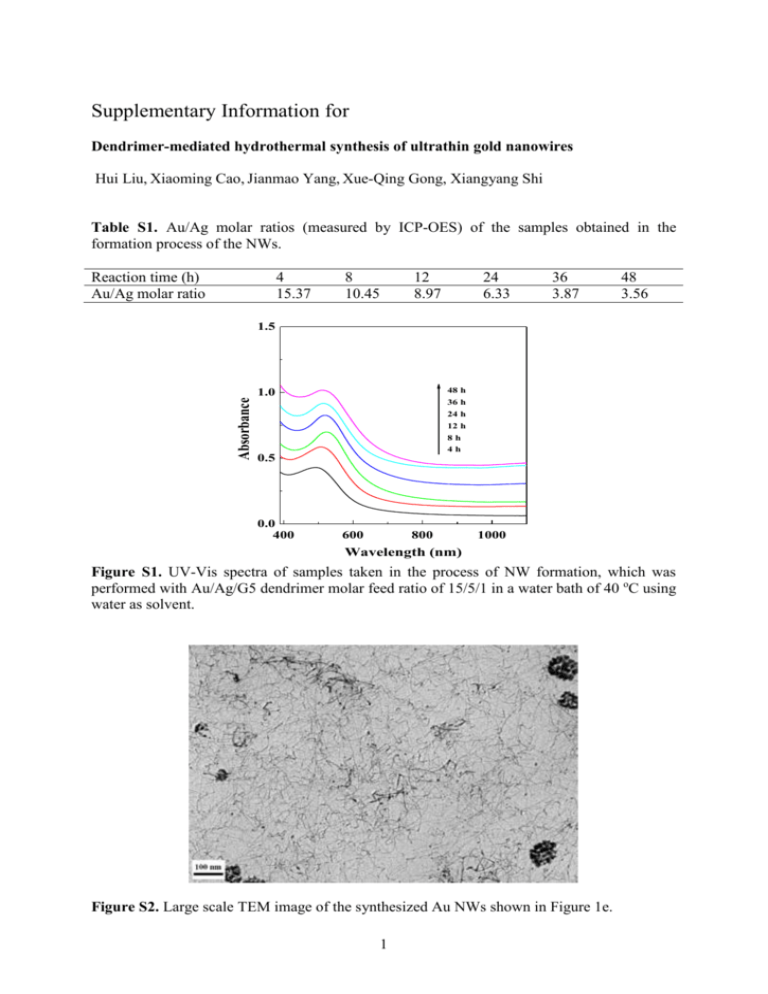
Supplementary Information for Dendrimer-mediated hydrothermal synthesis of ultrathin gold nanowires Hui Liu, Xiaoming Cao, Jianmao Yang, Xue-Qing Gong, Xiangyang Shi Table S1. Au/Ag molar ratios (measured by ICP-OES) of the samples obtained in the formation process of the NWs. Reaction time (h) Au/Ag molar ratio 4 15.37 8 10.45 12 8.97 24 6.33 36 3.87 48 3.56 Absorbance 1.5 48 h 1.0 36 h 24 h 12 h 8h 4h 0.5 0.0 400 600 800 1000 Wavelength (nm) Figure S1. UV-Vis spectra of samples taken in the process of NW formation, which was performed with Au/Ag/G5 dendrimer molar feed ratio of 15/5/1 in a water bath of 40 oC using water as solvent. Figure S2. Large scale TEM image of the synthesized Au NWs shown in Figure 1e. 1 Figure S3. TEM images of samples taken at 60 h (a) and 72 h (b) in the process of NW formation. The NWs were hydrothermally prepared using Au/Ag/G5 dendrimer molar feed ratio at 15/5/1 in a water bath of 40 oC. Right panels show the large scale micrographs of the NWs at the corresponding time points. Figure S4. TEM images of the products with varying Au/Ag molar feed ratios and all other experimental conditions were kept similar to those used to Au NWs shown in Figure 1e. The corresponding Au/Ag molar feed ratio from (a) to (c) is 15/0, 15/2.5, and 15/7.5, respectively. 2 Figure S5. TEM image of the products obtained by using NaNO3 as directing agent with all other experimental conditions similar to those used to synthesize the Au NWs shown in Figure 1e. Figure S6. TEM image of the NW products prepared by using G3.NH2 dendrimers as stabilizers with all other experimental conditions similar to those used to synthesize the Au NWs shown in Figure 1e. Figure S7. 1H NMR spectrum of the G5 dendrimer-stabilized Au NWs before (a) and after (b) acetylation. 3 Figure S8. A typical high-resolution TEM image of the NW samples at the reaction time of 8 h. Figure S9. Calculated structures of Au38 (a) and Au37Ag (b) (Au atoms in gold and Ag in light blue, the numbers are calculated Mulliken charges). Figure S10. Au4f core-level XPS spectrum and Ag3d core-level XPS spectrum of the formed NWs shown in Figure 1e. 4 Figure S11. TEM images of the products prepared at 20 oC (a) and 60 oC (b), respectively with all other experimental conditions similar to those used to synthesize the Au NWs shown in Figure 1e. Figure S12. Photographs of the samples obtained by using different solvents with all otherexperimental conditionssimilar to those used to synthesize the Au NWs shown in Figure 1e. (a) Ag/dendrimer = 5/1, (b) Au/dendrimer = 15/1, (c) Au/Ag/dendrimer = 15/5/1. Figure S13. TEM images of the products prepared by using DMSO (a) and methanol (b) with all other experimental conditions similar to those used to synthesize the Au NWs shown in Figure 1e. 5
