CIVL253 -HYDROLOGY
advertisement
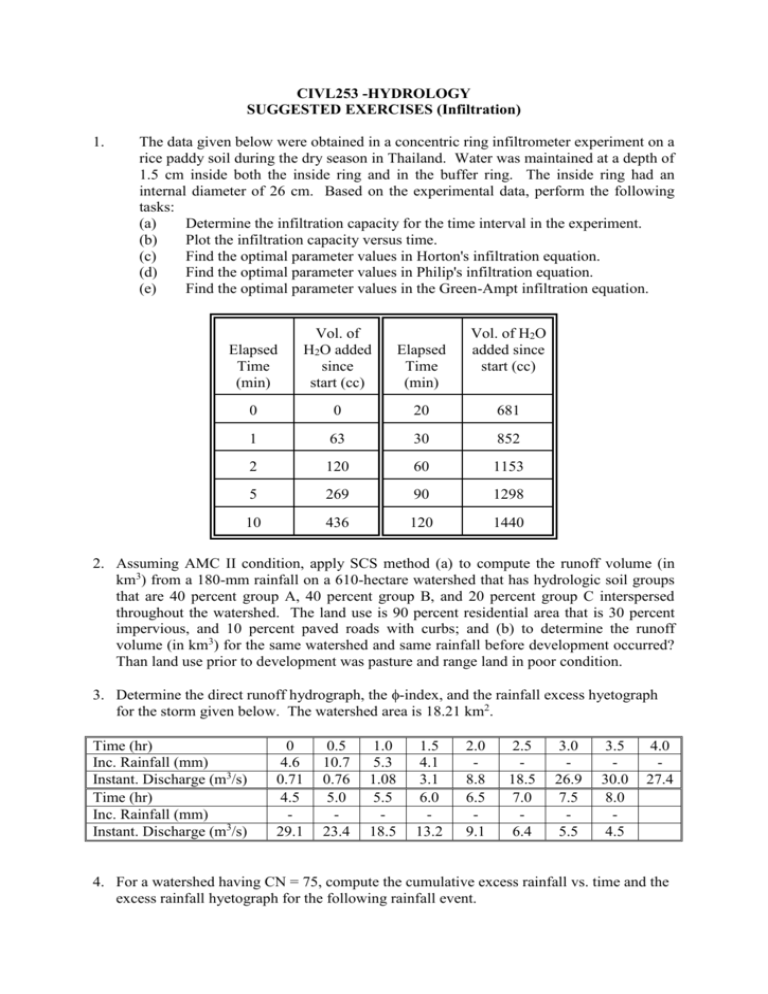
CIVL253 -HYDROLOGY SUGGESTED EXERCISES (Infiltration) 1. The data given below were obtained in a concentric ring infiltrometer experiment on a rice paddy soil during the dry season in Thailand. Water was maintained at a depth of 1.5 cm inside both the inside ring and in the buffer ring. The inside ring had an internal diameter of 26 cm. Based on the experimental data, perform the following tasks: (a) Determine the infiltration capacity for the time interval in the experiment. (b) Plot the infiltration capacity versus time. (c) Find the optimal parameter values in Horton's infiltration equation. (d) Find the optimal parameter values in Philip's infiltration equation. (e) Find the optimal parameter values in the Green-Ampt infiltration equation. Elapsed Time (min) Vol. of H2O added since start (cc) Vol. of H2O added since start (cc) Elapsed Time (min) 0 0 20 681 1 63 30 852 2 120 60 1153 5 269 90 1298 10 436 120 1440 2. Assuming AMC II condition, apply SCS method (a) to compute the runoff volume (in km3) from a 180-mm rainfall on a 610-hectare watershed that has hydrologic soil groups that are 40 percent group A, 40 percent group B, and 20 percent group C interspersed throughout the watershed. The land use is 90 percent residential area that is 30 percent impervious, and 10 percent paved roads with curbs; and (b) to determine the runoff volume (in km3) for the same watershed and same rainfall before development occurred? Than land use prior to development was pasture and range land in poor condition. 3. Determine the direct runoff hydrograph, the -index, and the rainfall excess hyetograph for the storm given below. The watershed area is 18.21 km2. Time (hr) Inc. Rainfall (mm) Instant. Discharge (m3/s) Time (hr) Inc. Rainfall (mm) Instant. Discharge (m3/s) 0 4.6 0.71 4.5 29.1 0.5 10.7 0.76 5.0 23.4 1.0 5.3 1.08 5.5 18.5 1.5 4.1 3.1 6.0 13.2 2.0 8.8 6.5 9.1 2.5 18.5 7.0 6.4 3.0 26.9 7.5 5.5 3.5 30.0 8.0 4.5 4.0 27.4 4. For a watershed having CN = 75, compute the cumulative excess rainfall vs. time and the excess rainfall hyetograph for the following rainfall event. Time (min) Inc. Rainfall (mm) Time (hr) Inc. Rainfall (mm) 10 2.7 100 20.0 20 3.1 110 10.6 30 3.6 120 7.5 40 4.2 130 4.9 50 4.4 140 4.3 60 5.7 150 3.6 70 7.8 160 3.2 80 13.0 170 3.0 90 36.0 180 2.5 5. Using the values in table (in lecture notes) containing Green-Ampt infiltration parameters determine points on the infiltration rate curve for sand, loam, and clay from time to 0 to 4 hours, at 0.5hr increments. Plot and compare these curves. Assume an initial effective saturation of 30 percent in each soil and continuous ponding.
