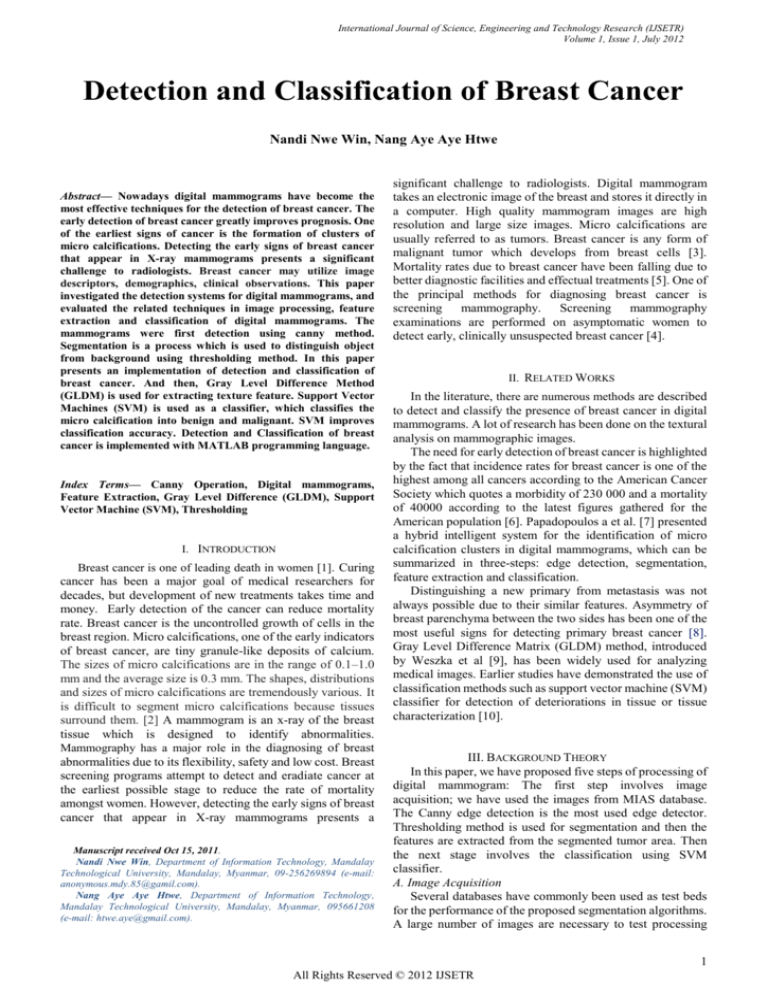
International Journal of Science, Engineering and Technology Research (IJSETR)
Volume 1, Issue 1, July 2012
Detection and Classification of Breast Cancer
Nandi Nwe Win, Nang Aye Aye Htwe
Abstract— Nowadays digital mammograms have become the
most effective techniques for the detection of breast cancer. The
early detection of breast cancer greatly improves prognosis. One
of the earliest signs of cancer is the formation of clusters of
micro calcifications. Detecting the early signs of breast cancer
that appear in X-ray mammograms presents a significant
challenge to radiologists. Breast cancer may utilize image
descriptors, demographics, clinical observations. This paper
investigated the detection systems for digital mammograms, and
evaluated the related techniques in image processing, feature
extraction and classification of digital mammograms. The
mammograms were first detection using canny method.
Segmentation is a process which is used to distinguish object
from background using thresholding method. In this paper
presents an implementation of detection and classification of
breast cancer. And then, Gray Level Difference Method
(GLDM) is used for extracting texture feature. Support Vector
Machines (SVM) is used as a classifier, which classifies the
micro calcification into benign and malignant. SVM improves
classification accuracy. Detection and Classification of breast
cancer is implemented with MATLAB programming language.
Index Terms— Canny Operation, Digital mammograms,
Feature Extraction, Gray Level Difference (GLDM), Support
Vector Machine (SVM), Thresholding
I. INTRODUCTION
Breast cancer is one of leading death in women [1]. Curing
cancer has been a major goal of medical researchers for
decades, but development of new treatments takes time and
money. Early detection of the cancer can reduce mortality
rate. Breast cancer is the uncontrolled growth of cells in the
breast region. Micro calcifications, one of the early indicators
of breast cancer, are tiny granule-like deposits of calcium.
The sizes of micro calcifications are in the range of 0.1–1.0
mm and the average size is 0.3 mm. The shapes, distributions
and sizes of micro calcifications are tremendously various. It
is difficult to segment micro calcifications because tissues
surround them. [2] A mammogram is an x-ray of the breast
tissue which is designed to identify abnormalities.
Mammography has a major role in the diagnosing of breast
abnormalities due to its flexibility, safety and low cost. Breast
screening programs attempt to detect and eradiate cancer at
the earliest possible stage to reduce the rate of mortality
amongst women. However, detecting the early signs of breast
cancer that appear in X-ray mammograms presents a
Manuscript received Oct 15, 2011.
Nandi Nwe Win, Department of Information Technology, Mandalay
Technological University, Mandalay, Myanmar, 09-256269894 (e-mail:
anonymous.mdy.85@gamil.com).
Nang Aye Aye Htwe, Department of Information Technology,
Mandalay Technological University, Mandalay, Myanmar, 095661208
(e-mail: htwe.aye@gmail.com).
significant challenge to radiologists. Digital mammogram
takes an electronic image of the breast and stores it directly in
a computer. High quality mammogram images are high
resolution and large size images. Micro calcifications are
usually referred to as tumors. Breast cancer is any form of
malignant tumor which develops from breast cells [3].
Mortality rates due to breast cancer have been falling due to
better diagnostic facilities and effectual treatments [5]. One of
the principal methods for diagnosing breast cancer is
screening mammography. Screening mammography
examinations are performed on asymptomatic women to
detect early, clinically unsuspected breast cancer [4].
II. RELATED WORKS
In the literature, there are numerous methods are described
to detect and classify the presence of breast cancer in digital
mammograms. A lot of research has been done on the textural
analysis on mammographic images.
The need for early detection of breast cancer is highlighted
by the fact that incidence rates for breast cancer is one of the
highest among all cancers according to the American Cancer
Society which quotes a morbidity of 230 000 and a mortality
of 40000 according to the latest figures gathered for the
American population [6]. Papadopoulos a et al. [7] presented
a hybrid intelligent system for the identification of micro
calcification clusters in digital mammograms, which can be
summarized in three-steps: edge detection, segmentation,
feature extraction and classification.
Distinguishing a new primary from metastasis was not
always possible due to their similar features. Asymmetry of
breast parenchyma between the two sides has been one of the
most useful signs for detecting primary breast cancer [8].
Gray Level Difference Matrix (GLDM) method, introduced
by Weszka et al [9], has been widely used for analyzing
medical images. Earlier studies have demonstrated the use of
classification methods such as support vector machine (SVM)
classifier for detection of deteriorations in tissue or tissue
characterization [10].
III. BACKGROUND THEORY
In this paper, we have proposed five steps of processing of
digital mammogram: The first step involves image
acquisition; we have used the images from MIAS database.
The Canny edge detection is the most used edge detector.
Thresholding method is used for segmentation and then the
features are extracted from the segmented tumor area. Then
the next stage involves the classification using SVM
classifier.
A. Image Acquisition
Several databases have commonly been used as test beds
for the performance of the proposed segmentation algorithms.
A large number of images are necessary to test processing
1
All Rights Reserved © 2012 IJSETR
International Journal of Science, Engineering and Technology Research (IJSETR)
Volume 1, Issue 1, July 2012
results with others for performance evaluations. In order to
overcome the difficulty in accessing hospitals and clinics
confidential files, there is a need for a public database.
MIAS (Mammographic Image Analysis Society Digital
Mammogram Database) are examples of well known and
broadly
used
mammographic
databases.
MIAS
mammography images are digitized at 200 micron pixel edge,
with a size of 1024 × 1024 pixels and it was published in
1994. Each pixel in the grayscale mammogram image
represents the pixel intensity in the range of [0, 255] (8-bit).
and it was published in 1994. Breast images in MIAS
database as shown in Figure 1.
measurement of tissue in medical image. These techniques
were widely applied in all image segmentations.
Thresholding
are more suitable for breast tumors
extraction since suspicious regions are belonging to the same
texture class, while surrounding tissues are belonging to
others During thresholding process, individual pixels in
images are separates into background (binary “0”) and
foreground (binary “1”). The segmented breast area as shown
in Figure 3.
Figure 3. Image Segmentation Using Thresholding
Figure 1. Breast images in MIAS database
B. Canny Edge Detection
The second step toward sectioning the image involves
finding edges. To do this, we use the canny edge detection,
available in MATLAB’s Image Processing Toolbox. Canny
method is a better method without disturbing the feature of
edges in the image.The Canny edge detector is a very popular
and effective edge feature detector and canny finds the
boundaries between the breast tissue and skin and between the
breast tissue and chest wall, which are precisely the edges we
need for creating the ROI boundary. The experimental result
of tested breast image by using canny method as shown in
Figure 2.
Figure 2. Edge Detection Using Canny Method
C. Image Segmentation
The Image segmentation is important to separate suspicious
areas of masses or micro calcifications from the background
texture. The objective of segmentation of suspicious areas is
to get the location and classify suspicious into benign or
malignant. The suspicious area of a mass has almost uniform
intensity, higher than the surrounding, and a regular shape
with various sizes. Thresholding is useful for detection and
D. Texture Features Extraction Using Gray Level Difference
Method (GLDM)
The evaluation of texture features is important for several
image processing applications. Texture analysis has been
used in a range of studies for recognizing synthetic and
natural textures. The texture features are ability to distinguish
between abnormal and normal cases. Gray Level Difference
Method (GLDM) is a good feature extraction method for our
implementation. We can use different feature extraction
methods and test them on variety of classifiers. We are using
GLDM feature descriptor.
The difference method is a generalized form of the GLDM,
which is based on the estimation of the pdf of gray level
differences in an image. GLDM seeks to extract texture features
that describe the size and prominence of textural elements in an
image. “Let I(x, y) be the image intensity function. For any
given displacement δ = (ΔΧ, ΔΥ) let I δ (x, y) = |I(x, y) - I (Χ + ΔΧ,
Υ + ΔΥ)|, and f (i|δ) be the probability density of Iδ (x, y). The
value of f (i|δ) is obtained from the number of times Iδ (x, y)
occurs for a given δ, i.e. f (i|δ) = P (Iδ (x, y) = i). If a texture is
directional, the degree of spread of the values in f (i|δ) should
vary with the direction of d, given that its magnitude is in the
proper range.
Thus, texture directionality can be analyzed by comparing
spread measures of f (i|δ) for various directions of d. In the
present study, four possible forms of the vector d were
considered :( 0, d), (d, 0), (-d, d), and (-d, -d), with d being the
inter pixel distance, each of which corresponds to a
displacement in 0̊, 45̊, 90̊ and 135̊ direction respectively. And
then the feature vectors can be derived the following the
feature as shown in Table 1.
TABLE I
DESCRIPTION OF TEXTURE FEATURES
Feature
Formula
2
All Rights Reserved © 2012 IJSETR
International Journal of Science, Engineering and Technology Research (IJSETR)
Volume 1, Issue 1, July 2012
1
Contrast
2
Mean
3
Entropy
Moment and Area. SVM Classifier is applied to these features
which classify the input image as malignant or benign. Overall
block diagram of the system is shown in Figure 4.
Digital Mammogram
Image Acquisition
4
Inverse Difference
Moment
5
Angular Second
Moment
6
Area
Edge Detection
Image Segmentation
A complete set of 480 features are used for the
classification of breast image. Finally, these sets of features
are used to classify the breast images.
E. Classification
There are numerous classification methods for automated
classification of samples. In this paper it’s decided to work
with most popular classification method: Support Vector
Machines (SVM). The Support Vector machines were
introduced by Vladimir Vapnik and colleagues. Support
Vector machines (SVM’s) are a relatively new learning
method used for binary classification. The basic idea is to find
a hyper plane which separates the D-Dimensional data
perfectly into its two classes. However, since example data is
often not linearly separable, SVM’s introduce the notion of a
kernel induced feature space which casts the data into a higher
dimensional space where the data is separable. Namely, the
primary goal of SVM classifiers is classification of examples
that belong to one of two possible classes. However, SVM
classifiers could be extended to be able to solve multiclass
problems as well. One of the strategies for adapting binary
SVM classifiers for solving multiclass problems is
one-against-all (OvA) scheme. It includes decomposition of
the M-class problem (M>2) into series of two-class problems.
The basic concept is to construct MSVMs where the i-th
classifier is trained to separate the class i from all other (M-1)
classes. This strategy has a few advantages such as its
precision, the possibility for easy implementation and the
speed in the training phase and the classification process. That
is reason for its wide use.
IV. SYSTEM DESIGN
A. Design of the Proposed System
In this system, Canny Method, Thresholding Technique, Gray
Level Difference Method and SVM are applied to implement
Detection and Classification of Breast Cancer System. In
image acquisition step, we have used the images from MIAS
database. The total 80 mammograms have been used. These
images are already processed. After applying GLDM feature
extractor following values is Contrast, Angular Second
moment, Entropy, Mean, Inverse Difference
Texture Feature Extraction
Support Vector Machines(SVM)
Classification(Benign, Malignant)
Figure 4. Overall Block Diagram of the System
V. EXPERIMENT AND RESULTS
For the experiment we have used MIAS database. It is a
collection of 80 images. We implemented GLDM feature
extraction method in Matlab. These images are already
processed. After applying GLDM feature extractor following
values are obtained. As in Table 2. SVM Classifier is applied
to these features which classify the input image as Benign or
malignant. This paper gives result for two images as shown in
Figure 5 and Figure 6.
TABLE II
GRAY LEVEL DIFFERENCE METHOD EXTRACTED FEATURES
FEATURES
IMAGE1
IMAGE2
Benign
Malignant
Angular Second
Moment
216.0473
156.3549
Contrast
52.1763
44.6791
Inverse Different
Moment
0.9604
0.5871
Mean
0.3044
0.2607
3
All Rights Reserved © 2012 IJSETR
International Journal of Science, Engineering and Technology Research (IJSETR)
Volume 1, Issue 1, July 2012
REFERENCES
Entropy
0.0117
0.0098
Area
0
72.2500
[1]
Figure 5. Input Image 1 for GLDM
Figure 6. Input Image 2 for GLDM
After extracting the features, the user runs the final
result Figure 7 are results of breast classification with
Malignant and Benign.
Breast
cancer,
Understanding
Breast
Cancer
Riskhttp://www.breastcancer.org/risk/understanding.
[2] Cheng, H.D., et al., Computer-aided detection and classification of
microcalcifications in mammograms: a survey. Pattern Recognition,
2003. 36(12): p. 2967-2991.
[3] G. Boccignone, A. Chianese, and A. Picariello ,“Computer Aided
detection
of
micro calcifications in digitalmammograms,”
Computers Biol. Medicine vol. 30,
no. 5,
pp. 267–286,
Sep. 1, 2000,10.1016/S0010- 4825(00)00014-7, 0010-4825.
[4] C. J. Vyborny, M. L. Giger,
and
R. M. Nishikawa, “Computer
aided
detection and diagnosis of breascancer, ” Radiologic Clinics
N. Amer., vol. 38, no. 4, pp. 725–740, Jul. 1, 2000, 10.1016/S00338389(05)70197-4, 0033-8389.
[5] A. Laine, J. Fan, and W. Yang,“Wavelets for contrast enhancement
Of digital mammography,” IEEE Eng. Medicine Biol., vol. 14, no. 5,
pp. 536–550, Sep./Oct.1995, 10.1109/51.464770.
[6] H. Jing,Y.Yang, and R.M.Nishikawa, “Detection of clustered micro
calcifications using spatial point process modeling,”Phys.Med. Biol.,
vol.56, no.1,2011,10.1088/0031-9155/56/1/001.
[7] A. Y. Cairns, I. W. Ricketts, D. Folkes, M. Nimmo, P. E. Preece, A.
Thompson, and C. Walker, “The automated detection of
clustersofmicrocalcifications,” in Proc. Inst. Elect. Eng. Colloquium
on Applications of Image Processing in Mass Health Screening, pp.
3/1–5, 1982.
[8] T.J. Rissanen, H.P. Makarainen, M.A. Apaja-Sarkki E.LLindholm,
Mammography and ultrasound in the diagnosis of contralateral breast
cancer, Acta Radiol. 36 (1995) 358–366.
[9] Weszka, J. S., C. R. Dyer, and A Rosenfield. A comparative study of
texture measures for terrain classification. Trans. Systems, Man, and
Cybernetics, SMC-6(4) :269–285, 1976
[10] Laufer, S.; Rubinsky, B. Tissue characterization with an electrica
spectroscopy SVM classifier. I EEE Trans. Biomed. Eng. 2009,56,
525–528.
Figure 10. SVM Classification result of the program
VI. CONCLUSIONS
Mammography is one of the best methods in breast cancer
detection, but in some cases, radiologists cannot detect
tumors despite their experience. Such Canny Edge Detecion
like those presented in this paper could assist medical staff
and improve the accuracy of detection. In this paper, we made
analysis on SVM classifier, using GLDM technique for
feature extraction. According to the provided examination,
we can say that GLDM method can be used for classification
of support vector machines. It was evaluated on 80 images
containing malignant and benign masses with different size
and shape. Using the SVM classifier, breast cancer diagnosis
with accuracy of 92% is achieved.
ACKNOWLEDGMENT
First and foremost, the author would like to express her
thanks to supervisor Dr. Nang Aye Aye Htwe, Department of
Information Technology, the Mandalay Technological
University, for her kindness, supports, helpful suggestion and
true-line guidance for completion of this paper. The author
wishes to express special thanks to Dr. Aung Myint Aye,
Associate Professor and Head and her teachers at Department
of Information technology, Mandalay Technological
University, for their encouragement, support and guidance
during the theoretical study and thesis preparation.
4
All Rights Reserved © 2012 IJSETR


