Education and Training for Young People in the Youth Justice System
advertisement
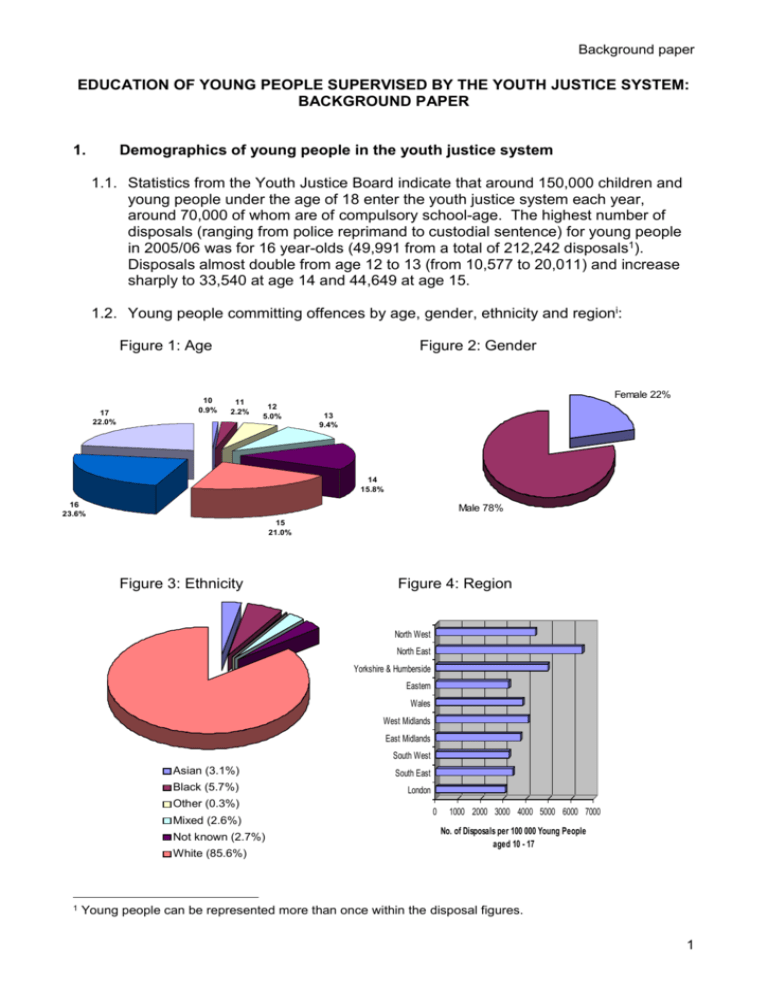
Background paper EDUCATION OF YOUNG PEOPLE SUPERVISED BY THE YOUTH JUSTICE SYSTEM: BACKGROUND PAPER 1. Demographics of young people in the youth justice system 1.1. Statistics from the Youth Justice Board indicate that around 150,000 children and young people under the age of 18 enter the youth justice system each year, around 70,000 of whom are of compulsory school-age. The highest number of disposals (ranging from police reprimand to custodial sentence) for young people in 2005/06 was for 16 year-olds (49,991 from a total of 212,242 disposals1). Disposals almost double from age 12 to 13 (from 10,577 to 20,011) and increase sharply to 33,540 at age 14 and 44,649 at age 15. 1.2. Young people committing offences by age, gender, ethnicity and regioni: Figure 1: Age 17 22.0% 10 0.9% Figure 2: Gender 11 2.2% Female 22% 12 5.0% 13 9.4% 14 15.8% 16 23.6% Male 78% 15 21.0% Figure 3: Ethnicity Figure 4: Region North West North East Yorkshire & Humberside Eastern Wales West Midlands East Midlands South West Asian (3.1%) South East Black (5.7%) London Other (0.3%) Mixed (2.6%) Not known (2.7%) 0 1000 2000 3000 4000 5000 6000 7000 No. of Disposals per 100 000 Young People aged 10 - 17 White (85.6%) 1 Young people can be represented more than once within the disposal figures. 1 Background paper 1.3. The most recent census of the population of England and Wales (Office of National Statistics, 2001) found that, of the total UK population, 92 per cent were white, 4 per cent were Asian, 2 per cent were black and 1.2 per cent were of mixed race. Therefore comparisons of the general population against the offending population suggests that those who are black or mixed race are overrepresented in the youth justice system, although this is complicated by the fact that a larger proportion of the black and mixed race population is under 16. 55 per cent of the mixed race population and 25 per cent of the black population is under 16, compared to 19 per cent of the white population. 2. Sentencing of young people in the Youth Justice System 2.1. More than three-quarters (approximately 120,000) of young offenders are given pre-court or first-tier interventions such as curfews or fines. Around 17 per cent are subject to a community sentence and around 4 per cent are sentenced to custody. 2.2. The majority of young people serving sentences therefore receive community interventions including community punishment orders, action plan orders and attendance centre orders. Many of these contain an element of education and training, combined with unpaid work in the community and victim awareness sessions. Community sentences can last from a few weeks to three years. 2.3. For young people sentenced to custody, most are on relatively short sentences, with the average time spent in custody being four months. Around 92 per cent of young people receiving a custodial sentence are on detention and training orders, which require half the sentence to be served in custody and the last half in the community. The minimum length for detention and training orders is four months and the maximum is two years. 3. Custodial establishments for young people 3.1. Young people can either be remanded to custody prior to sentencing or they can be sentenced to custody. They can be held in one of three types of institution: 3.1.1. Young offender institutions Run by the Prison Service for 15-21 year-olds (with 15-17 and 18-21 year-olds held separately). There are 17 young offender institutions across the country, accommodating around 2,700 young people in totalii. The smallest (Eastwood Park) accommodates 16 young people and the largest (Ashfield) accommodates 400. 3.1.2. Secure training centres Privately run by contractors for young people aged 10-17. There are four secure training centres across the country, housing around 274 young people in total. The smallest (Hassockfield) accommodates 42 young people and the largest (Oakhill) accommodates 80. 3.1.3. Secure children’s homes 2 Background paper The majority are run by local authorities for vulnerable young offenders aged 10 to 17 (only one, Orchard Lodge, is run by a private contractor). There are 15 secure children’s homes across the country, accommodating around 235 young people in total. The smallest (Aldine House) houses 5 young people and the largest (East Moor Secure Unit) accommodates 34. 3.2. The type of institution a young person is held in is governed by the Youth Justice Board placement policy and placement protocol. The Youth Justice Board’s placements team makes individual placement decisions based on a range of factors including the vulnerability assessment of the young person completed by the youth offending team, the available places across the sector and the needs of other young people already in the system. 3.3. When in custody young people can also be moved between institutions during their sentence. The Youth Justice Board estimates that a young person stands a one in four chance of being moved during the custodial phase of a detention and training order.iii 4. Re-offending rates and associated costs 4.1. Re-offending rates are high; 78.2 per cent of young people sentenced to custody re-offend within one year, for community sentences, this figure is 70.3 per centiv. Research suggests that re-offending costs to society are high: the total cost of recorded crime committed by ex-prisoners is estimated at around £11 billion per yearv. Around 4 per cent of all ex-prisoners are young offenders, therefore crude calculations suggest that the annual re-offending costs of just this one group (excluding young offenders on community sentences) could be upwards of £440 million. 4.2. According to the Audit Commission, early intervention to prevent young people offending could save public services more than £80 million a yearvi. It costs just over £4000 to educate a child at school for a year, compared with almost double this to educate them in a young offender institution for a year. It has also been estimated that the cost of education per bed space is eight to ten times greater in secure training centres and secure children’s homes than in young offender institutions.vii It costs a total of over £60,000 per year to house each young person in a young offender institution and upwards of £200,000 in secure training centres and secure children’s homes. In 2006, the Youth Justice Board spent £281 million on secure accommodation.viii 5. Young offenders’ personal backgrounds 5.1. The evidence tells us that this group of young people are some of the most disadvantaged in society. They have complex needs, some with a history of substance misuse, mental health needs, and disrupted family backgrounds. 3 Background paper Figure 4: Young people in the youth justice system with complex needsix % 6. 90 80 70 60 50 40 30 20 10 0 Used a drug in last year Diagnosable m ental health disorder Live w ith both parents Previous experience of care Educational background of young offenders 6.1. Comparisons of the educational background of young people supervised by the youth justice system with the general population show that, on average, young offenders have had difficult and often poor previous experiences of education. Low attainment, persistent truancy, exclusion and Special Educational Needs are some of the most prevalent risk factors associated with offending behaviour. Figure 5: Education indicators of young offenders compared with the general young populationx 60 50 40 % 30 20 10 0 Statement of SEN Previous permanent exclusions Regularly truanting General young population 7. 5 A-Cs GCSE Young Offender Links between education and offending/re-offending 7.1. The correlations between education, offending and re-offending are well documented. A Mori youth survey suggests that excluded young people are committing twice as many crimes as their peers in mainstream education.xi 7.2. A survey of young people in young offender institutions found that 83 per cent of 4 Background paper boys had been excluded and 41 per cent of boys and girls were aged 14 or younger when they were last in school.xii Furthermore, statistics suggest that the numbers of young offenders who are excluded from school are rising. In the mid1990s, two out of every five young people of school-age who appeared before the youth court had been either temporarily or permanently excluded from school.xiii A more recent survey based on a sample of youth offending team clients showed that this had almost doubled to three out of four.xiv 7.3. According to one study2, none of those who had full-time education immediately after they were released back into the community on a detention and training order were reconvicted, whereas one-third of those without such immediate provision were reconvicted.xv Both the Youth Justice Board’s and Department for Education and Skill’s research has pointed to the key preventative role of education. The 2005 Department for Education and Skills report Preventing Children’s Involvement in Crime and Anti-Social Behaviour highlights the fact that children who lack commitment to school feel a sense of alienation which often leads to involvement in anti-social behaviour. The Youth Justice Boards 2005 study of risk and protective factors associated with youth crimexvi found considerable overlap between risk factors for youth offending and those for educational underachievement. Lack of statutory education was one of the largest factors associated with re-offending. 7.4. By the end of 2005, 11 per cent of 16-18 year-olds (220,000) were not in education, employment or training. The Youth Justice Board report, Barriers to Engagementxvii reports that more than a third of young offenders above school leaving age had no kind of education, training or employment arranged, suggesting that young offenders make up a significant proportion of the cohort of young people not in education, employment or training. A survey into those not in education, employment or training by Leicester Connexions Partnership found that those supervised by youth offending services were over five times more likely to be not in education, employment or training.xviii 8. International context to the UK youth justice system 8.1. The Youth Justice system in the United Kingdom is dissimilar from many others, particularly in Europe. The United Kingdom has one of the largest proportions of children in custody (as a percentage of the overall prison population) in the world. Caution must be applied, though, when comparing different countries as justice and welfare systems differ dramatically and we cannot make direct comparisons. 2 This study was based on 109 respondents which represented a quarter of those who where due to be released within one month of the study. 5 Background paper 8.2. Figure 6: International comparison of percentage of under 18s as a proportion of the total prison population.xix 4 3 2 % 1 0 Spain JapanAustrailaUSA Denm arkSouth Russia Africa UK 8.3. Finland presents an interesting example of an alternative system for dealing with young people engageing in offending behaviour. Within Finland ‘young offenders’ under 15 are dealt with by child welfare authorities, with the system of criminal justice only being applied to those aged 15-17. The criterion for all child welfare interventions is ‘the best interest of the child’ and juvenile crime is viewed as arising from social conditions which should be addressed by further investment in health and children’s services. Despite rapidly falling rates of incarceration in recent years, Finland’s crime rates have remained stable.xx 8.4. In Germany, only a small proportion of juveniles who appear in court are ultimately sent to custody. As an alternative, Germany uses ‘social training’ courses which involve regular meetings with social workers and intensive weekend arrangements with sporting activities such as sailing and mountain climbing to foster the development of social skills and appropriate behaviour. REFERENCES i Youth Justice Board, Youth Justice Annual Statistics 2005-06, YJB 2007 All figures relating to numbers of young people in secure establishments are YJB figures as at April 2005. iii Youth Justice Board, Progress Report on the Implementation of the Youth Justice Board’s National Specification for Learning and Skills in the Juvenile Prison Estate 2003-04, YJB 2004 iv Whiting and Cuppleditch, Re-offending of juveniles: results from the 2004 cohort, Home Office 2006 v Reducing Re-offending by Ex-Prisoners, Social Exclusion Unit 2002 vi http://www.youth-justice-board.gov.uk/YouthJusticeBoard/Prevention/ vii Social Exclusion Unit, Reducing Re-offending by ex-prisoners, Social Exclusion Unit 2002 viii Youth Justice Board, Annual Report and Accounts 2005/06, YJB 2006 ix Drug use: Budd et al , Young People and Crime: Findings from the 2004 Offending, Crime and Justice Survey, Home Office 2002 Mental health: Child and Adolescent Mental Health Services (CAMHS) Standard for the National Service Framework, 2004 One parent: Youth Justice Board, Gaining Ground in the Community 2002/03, London: YJB 2003 Care: Hart, Tell them not to forget about us: A guide to practice with looked after children in custody, London: National Children’s Bureau 2006 ii 6 Background paper x SEN: Youth Justice Board , Evaluation of Asset, Oxford University 2002 Exclusion and truancy: Youth Justice Board (2003) op cit GCSEs: Hammersley et al (2003) Substance Use by Young Offenders: The Impact of Normalisation of Drugs Use in the Early Years of the 21st Century, Home Office research study 261 xi MORI Youth Survey (2004), cited in Barriers to Engagement in education, training and employment, Youth Justice Board 2006 xii HMIP, Juveniles in Custody: A unique insight into the perception of young people held in the Prison Service, HM Inspectorate of Prisons 2003 xiii Audit Commission, Misspent Youth, Audit Commission 1996 xiv Hammersley et al, Substnace Use by Young Offenders: The Impact of the Normalisation of Drugs Use in the Early Years of the 21st Century, Home Office 2003 xv ECOTEC, An Audit of Education within the Juvenile Secure Estate, YJB 2001. These figures were drawn from a sample of 109 young offenders leaving custody, which represents around a quarter of all young people leaving custody in the sample month. xvi Youth Justice Board, A Summary of Risk and Protective Factors Associated with Youth Crime and Effective Interventions to Prevent It, YJB 2005 xvii Youth Justice Board Barriers to engagement in education, training and employment, London: YJB 2006 xviii Likelihood of Not being in education, Employment or Training (NEET) in Leicestershire County 16-18 year olds, at www.connexions-leics.org/staffroom/res_stats_share.asp xix Source for graph: http://www.prisonstudies.org xx John Munice and Barry Goldson (Eds), Comparative Youth Justice, London: SAGE, 2006 7
