Outcomes Table for Problem 6.3
advertisement
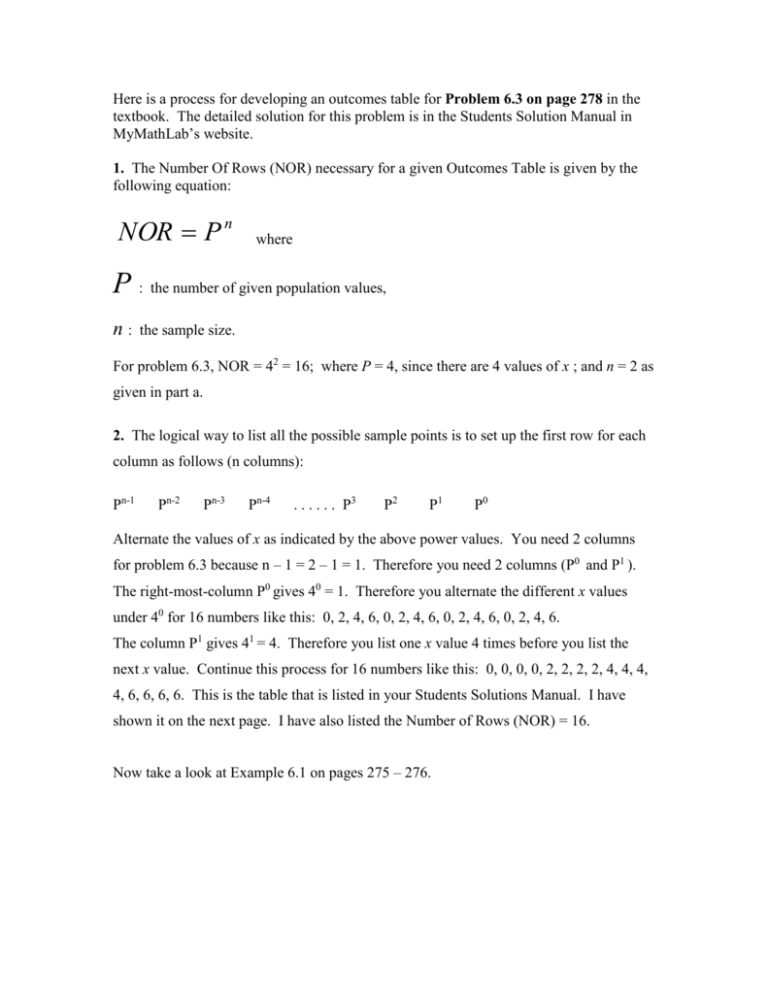
Here is a process for developing an outcomes table for Problem 6.3 on page 278 in the textbook. The detailed solution for this problem is in the Students Solution Manual in MyMathLab’s website. 1. The Number Of Rows (NOR) necessary for a given Outcomes Table is given by the following equation: NOR P n where P : the number of given population values, n: the sample size. For problem 6.3, NOR = 42 = 16; where P = 4, since there are 4 values of x ; and n = 2 as given in part a. 2. The logical way to list all the possible sample points is to set up the first row for each column as follows (n columns): Pn-1 Pn-2 Pn-3 Pn-4 . . . . . . P3 P2 P1 P0 Alternate the values of x as indicated by the above power values. You need 2 columns for problem 6.3 because n – 1 = 2 – 1 = 1. Therefore you need 2 columns (P0 and P1 ). The right-most-column P0 gives 40 = 1. Therefore you alternate the different x values under 40 for 16 numbers like this: 0, 2, 4, 6, 0, 2, 4, 6, 0, 2, 4, 6, 0, 2, 4, 6. The column P1 gives 41 = 4. Therefore you list one x value 4 times before you list the next x value. Continue this process for 16 numbers like this: 0, 0, 0, 0, 2, 2, 2, 2, 4, 4, 4, 4, 6, 6, 6, 6. This is the table that is listed in your Students Solutions Manual. I have shown it on the next page. I have also listed the Number of Rows (NOR) = 16. Now take a look at Example 6.1 on pages 275 – 276. All possible outcomes for problem 6.3. 41 = 4 40 = 1 Row 0 0 1 0 2 2 0 4 3 0 6 4 2 0 5 2 2 6 2 4 7 2 6 8 4 0 9 4 2 10 4 4 11 4 6 12 6 0 13 6 2 14 6 4 15 6 6 16 To calculate the means, medians, and variances for each outcome, do the following. Put each possible sample (each row) in your list1 in your calculator and do your 1-variable statistics calculation. For example, look at Row 2. Put in 0 and 2 in list1. Push the button for the 1-variable statistic to get the mean = 1, the median = 1, and Sx = 1.4142136. Therefore, the variance (Sx)2 = 2. You will need to do these calculations for all 16 rows. See Sections 2.4 and 2.5 in your textbook for the formulas for the mean, median and variance.
