12 359-2013 BREEDING STRATEGIES FOR DEVELOPING
advertisement
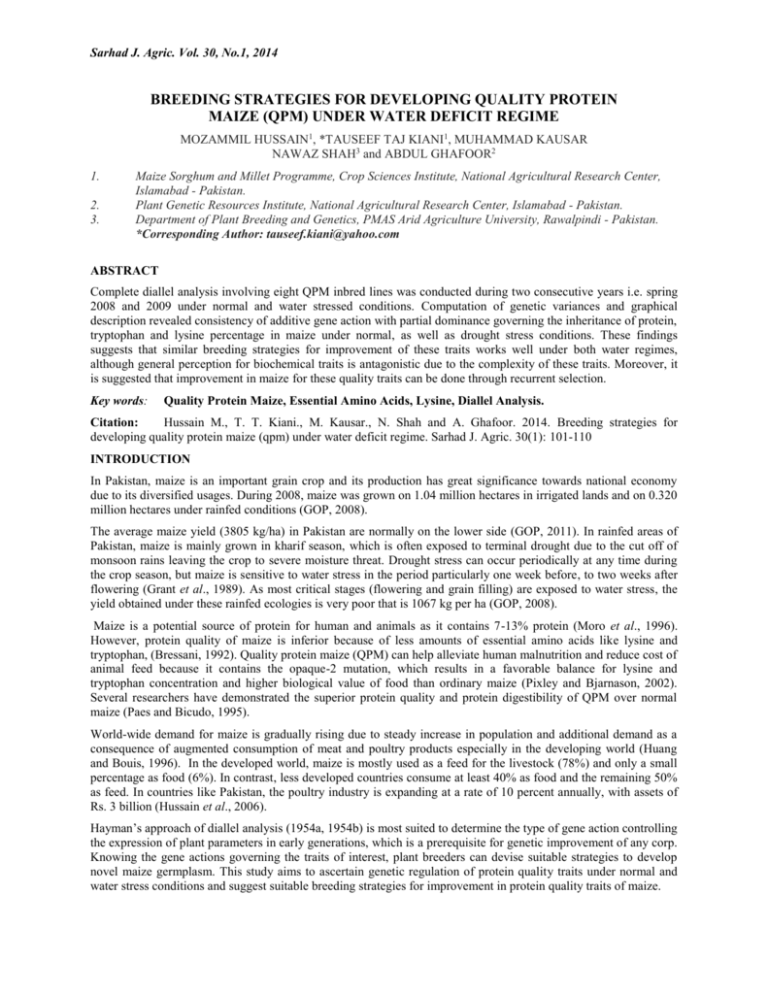
Sarhad J. Agric. Vol. 30, No.1, 2014 BREEDING STRATEGIES FOR DEVELOPING QUALITY PROTEIN MAIZE (QPM) UNDER WATER DEFICIT REGIME MOZAMMIL HUSSAIN1, *TAUSEEF TAJ KIANI1, MUHAMMAD KAUSAR NAWAZ SHAH3 and ABDUL GHAFOOR2 1. 2. 3. Maize Sorghum and Millet Programme, Crop Sciences Institute, National Agricultural Research Center, Islamabad - Pakistan. Plant Genetic Resources Institute, National Agricultural Research Center, Islamabad - Pakistan. Department of Plant Breeding and Genetics, PMAS Arid Agriculture University, Rawalpindi - Pakistan. *Corresponding Author: tauseef.kiani@yahoo.com ABSTRACT Complete diallel analysis involving eight QPM inbred lines was conducted during two consecutive years i.e. spring 2008 and 2009 under normal and water stressed conditions. Computation of genetic variances and graphical description revealed consistency of additive gene action with partial dominance governing the inheritance of protein, tryptophan and lysine percentage in maize under normal, as well as drought stress conditions. These findings suggests that similar breeding strategies for improvement of these traits works well under both water regimes, although general perception for biochemical traits is antagonistic due to the complexity of these traits. Moreover, it is suggested that improvement in maize for these quality traits can be done through recurrent selection. Key words: Quality Protein Maize, Essential Amino Acids, Lysine, Diallel Analysis. Citation: Hussain M., T. T. Kiani., M. Kausar., N. Shah and A. Ghafoor. 2014. Breeding strategies for developing quality protein maize (qpm) under water deficit regime. Sarhad J. Agric. 30(1): 101-110 INTRODUCTION In Pakistan, maize is an important grain crop and its production has great significance towards national economy due to its diversified usages. During 2008, maize was grown on 1.04 million hectares in irrigated lands and on 0.320 million hectares under rainfed conditions (GOP, 2008). The average maize yield (3805 kg/ha) in Pakistan are normally on the lower side (GOP, 2011). In rainfed areas of Pakistan, maize is mainly grown in kharif season, which is often exposed to terminal drought due to the cut off of monsoon rains leaving the crop to severe moisture threat. Drought stress can occur periodically at any time during the crop season, but maize is sensitive to water stress in the period particularly one week before, to two weeks after flowering (Grant et al., 1989). As most critical stages (flowering and grain filling) are exposed to water stress, the yield obtained under these rainfed ecologies is very poor that is 1067 kg per ha (GOP, 2008). Maize is a potential source of protein for human and animals as it contains 7-13% protein (Moro et al., 1996). However, protein quality of maize is inferior because of less amounts of essential amino acids like lysine and tryptophan, (Bressani, 1992). Quality protein maize (QPM) can help alleviate human malnutrition and reduce cost of animal feed because it contains the opaque-2 mutation, which results in a favorable balance for lysine and tryptophan concentration and higher biological value of food than ordinary maize (Pixley and Bjarnason, 2002). Several researchers have demonstrated the superior protein quality and protein digestibility of QPM over normal maize (Paes and Bicudo, 1995). World-wide demand for maize is gradually rising due to steady increase in population and additional demand as a consequence of augmented consumption of meat and poultry products especially in the developing world (Huang and Bouis, 1996). In the developed world, maize is mostly used as a feed for the livestock (78%) and only a small percentage as food (6%). In contrast, less developed countries consume at least 40% as food and the remaining 50% as feed. In countries like Pakistan, the poultry industry is expanding at a rate of 10 percent annually, with assets of Rs. 3 billion (Hussain et al., 2006). Hayman’s approach of diallel analysis (1954a, 1954b) is most suited to determine the type of gene action controlling the expression of plant parameters in early generations, which is a prerequisite for genetic improvement of any corp. Knowing the gene actions governing the traits of interest, plant breeders can devise suitable strategies to develop novel maize germplasm. This study aims to ascertain genetic regulation of protein quality traits under normal and water stress conditions and suggest suitable breeding strategies for improvement in protein quality traits of maize. Mozammil Hussain, et al. Breeding strategies for developing quality protein maize… 102 MATERIALS AND METHODS Eight maize inbred lines NCMLQ1, NCMLQ2, NCMLQ3, NCMLQ4, NCMLD1, NCMLD2, NCMLD3, and NCMLD4 w were used to constitute a complete 8 x 8 diallel cross. Two separate trials containing F1 hybrids along with their parents were sown during Spring 2008 and 2009, following randomized complete block design. A plot of 6m2 having two rows of four meter length, replicated thrice was sown in the research field on Maize, Sorghum and Millet Program, at National Agriculture Research Centre Islamabad One trial was managed at normal 16 level of irrigations throughout the crop cycle, three inch each as practiced for raising commercial maize crop, while in the second trial, the irrigation was stopped to induce water stress one week prior to start of anthesis to two weeks after completion of silk emergence. Additionally, meteorological data on rainfall and maximum temperature during the critical period i.e. of flowering and early endosperm development were recorded (Fig. 4). Data on protein content, lysine percentages and tryptophan percentages were recorded on samples of kernels shelled from individual ear from ten guarded plants in each replication as per given details. Protein Percentage Maize flour was prepared by milling the maize grains through Udy Cyclone Mill, from 25-30 maize kernels, after removing embryos latter crude protein percentages were determined by Kjeldhal’s method of nitrogen estimation as described by Pearson (1976). Tryptophan Percentage Tryptophan percentages determinations were specified by HPLC and Quality Index (QI) according to the methods described in the Quality Protein Breeding Manual (Vivik et al., 2008). Lysine Percentage Lysine percentages determinations were specified by HPLC according to the methods described in the Quality Protein Breeding Manual (Vivik et al., 2008). Biometrical Analysis Analysis of variance (Steel and Torrie, 1980) and Hayman’s diallel analysis (Hayman, 1954a, 1954b) were computed, accordingly. However, two scaling tests, regression analysis and analysis of Wr + Vr and Wr – Vr were carried out as a prerequisite. This was necessary, because in case any of these tests establishes the adequacy of the data sets for Additive – Dominance Model for a particular trait, only then data set of that particular parameter has to be used for diallel analysis. RESULTS AND DISCUSSIONS Analysis of variance showed significant differences (P≤0.01) across both water regimes, thereby the data was pursued to proceed for Hayman's Analysis of Variance for the traits under study. The results of these analyses are given in Tables 1 and 2 respectively. Both of the scaling tests, i.e. joint regression analysis for coefficients of b and uniformity of Wr-Vr tests (t2 test), were employed to judge the adequacy of the data sets for each trait, data on every parameter qualified by any of the above tests, except for the data set on tryptophan percentages in the trial planted under normal irrigation during the second year of testing. Expect this trial, 1st and 2nd degree genetic parameters were worked out for all traits under both levels of water supply for consecutive two years. The results of these analyses are given in Table 3 and Table 4. Protein Percentage Highly significant ‘a’ and ‘b’ values forecasts the involvement of additive as well as non-additive genetic effects regarding protein contents in maize kernel endosperm, constantly under normal and curtailed irrigation trials (Table 2). 103 Sarhad J. Agric. Vol. 30, No.1, 2014 Table 1. Mean squares of various protein quality traits in 8 × 8 diallel cross under normal and drought stress conditions. Source of Variation df Tryptophan Protein Percentage Lysine Percentage Percentage 2008 2009 2008 2008 2009 2008 Source (under normal condition) Replications Genotypes Error 2 63 126 15.24** 0.40** 0.02 0.17** 0.56** 0.0009 0.001n.s 0.009** 0.001 15.24** 0.40** 0.02 0.17** 0.56** 0.0009 0.001n.s 0.009** 0.001 2 63 126 0.13** 0.63** 0.006 0.09** 0.51** 0.005 0.002** 0.004** 0.0002 0.0029** 0.003** 0.0002 0.012n.s 0.065** 0.005 0.04** 0.06** 0.004 Source (under drought condition) Replications Genotypes Error Significant (P≤0.01) ‘b1’, ‘b2’ and ‘b3’ values supported the presence of directional dominance effects, asymmetrical distribution for dominant genetic effects among parents and existence of specific dominance not attributable to ‘b 1’ and ‘b2’ items. Maternal effects were interacting in the heredity of this character as evidenced by a significant ‘c’ item at higher probabilities in contrasted trials during 2008. However, reciprocal and maternal effects fell to nonsignificance in the contrasted trials during the second year of testing under normal irrigation and in the drought imposed trial. Mean values of ‘c’ as proposed by Mather and Jinks (1982), after retesting mean square of b 1 reverted to non-significance in the contrasted trials except that one planted during the first year of testing wherein additive effects prevailed across irrigation supplies. This showed that additive gene actions were present in the manifestation of protein percentage as revealed by the significance ‘a’. Table 2. Hayman’s analysis of variance for protein quality traits in 8 × 8 diallel cross under normal and drought stress conditions. Means squares Protein Percentage Tryptophan Percentage Lysine Percentage S.O.V (under normal df 2008 2009 2008 2009 2008 2009 conditions) Replications 2 16.24** 0.165** 0.0011** 0.0059** 0.0049ns 0.0042ns a 7 2.99**-c 3.681** 0.052** 0.0369** 0.365** 0.49**-c b 28 0.1928** 0.245** 0.008** 0.002** 0.040** 0.04** b1 1 0.4972** 0.86** 0.016** 0.0004** 0.329** 0.46** b2 7 0.1102*** 0.232** 0.009** 0.0018** 0.035** 0.04** b3 20 0.2065** 0.218** 0.008** 0.0022** 0.027** 0.03** c 7 0.1229** 0.001ns 0.00094ns 0.000002ns 0.001ns 0.11** d 21 0.0023ns 0.001ns 0.00059ns 0.000002ns 0.001ns 2.4E-06ns Error 126 0.0071 0.001 0.0010 0.00002 0.0041 0.0029 Total 191 20.3673 5.404 0.0120 0.0492 0.0676 0.0934 S.O.V (under drought conditions) Replications 2 0.1313** 0.08984** 0.002** 0.0029 0.012ns 0.039** a 7 4.636**-c 3.68597** 0.024** 0.0194 0.371** 0.38** b 28 0.2136** 0.22444** 0.0036** 0.0016 0.050** 0.03** b1 1 0.7104** 0.89074** 0.0491** 0.0082 0.449** 0.13** b2 7 0.1535** 0.14768** 0.0038** 0.0012 0.020** 0.02** b3 20 0.2097** 0.21799** 0.0012** 0.0014 0.041** 0.03** c 7 0.142** 0.00125ns 0.0003ns 0.000002ns 0.002ns 0.001ns d 21 0.0027ns 0.00069ns 0.0001ns 0.000002ns 0.003ns 0.0003ns Error 126 0.006 0.00545 0.0002 0.0002 0.005 0.0039 Total 191 6.2052 5.26405 0.0843 0.0349 0.082 0.0995 ** = significant (P≤0.01), * = significant (P≤0.05) and ns = non significant, -c : maternal effects prevailed after retesting Inter play of additive and dominance gene action were imparted by the D and H 2 variance and those of h2 values, over the two regimes, except those that these components remained non-significant during first year trial under normal irrigation (Table 3). Non-significant negative values of F ruled out major contribution of dominant genes in the control this trait. Asymmetry at loci with dominance gene action was there as (H2/4H1) ratios ranged between 0.18 – 0.20 (Table 4). Values for KD/KR allocated less genes (0.40-0.49) exerting dominance. Visual analysis revealed by the Wr-Vr graph (Figure 1) helped in making the decision that protein content was under the control of Mozammil Hussain, et al. Breeding strategies for developing quality protein maize… 104 additive gene actions with less emphasis on dominance gene action to the extent of partial dominance as positive intercept of the regression line was observed. The genetic component analysis for the (H 1/D)½ values remained below unity, its value ranged between 0.80-0.95, affirming the role of partial dominance with more stress on additive genetic effects. Configuration of array points along regression plot assigned maximum dominant genes to the inbred line NCMLD4 positioning it near to the origin while NCMLQ3 was the parent with the maximum recessive alleles falling at the farthest from origin at both levels of water supply. Present findings agreed with the results derived by Kumar et al. (2002) who reported the same type gene action for protein content in maize kernels. However, these results disagreed with those inferred by Joshi et al. (1998) and Irshad-ul-Haq (2010) who were pro over dominance for the same character. Fig. 1. Wr-Vr Graphs for protein percentage. Parents: 1. NCMLQ1, 2. NCMLQ2, 3. NCMLQ3, 4. NCMLQ4, 5. NCMLD1, 6. NCMLD2, 7. NCMLD3 and 8. NCMLD4 105 Sarhad J. Agric. Vol. 30, No.1, 2014 Validity questioned by both tests for trial under normal-2009. Fig. 2. Wr-Vr Graphs for tryptophan percentage. Parents: 1. NCMLQ1, 2. NCMLQ2, 3. NCMLQ3, 4. NCMLQ4, 5. NCMLD1, 6. NCMLD2, 7. NCMLD3 and 8. NCMLD4 Mozammil Hussain, et al. Breeding strategies for developing quality protein maize… Fig. 3. Wr-Vr Graphs for Lysine Percentage. Parents: 1. NCMLQ1, 2. NCMLQ2, 3. NCMLQ3, 4. NCMLQ4, 5. NCMLD1, 6. NCMLD2, 7. NCMLD3 and 8. NCMLD4 Fig. 4. Meteorological data for the month of April and May 2008/2009. 106 107 Sarhad J. Agric. Vol. 30, No.1, 2014 Table 3: First degree statistics of genetic variation for various protein quality traits in 8x8 diallel cross in maize (2008-09). Genetic Parameters Plant Characters Trials D H1 H2 F h2 2008 (Normal) 0.17 ±0.14 0.147 ±0.03 0.12 ±0.02 -0.048 ±0.03 0.072 ±0.02 2009 (Normal) 0.24 ±0.02 0.220 ±0.04 0.163 ±0.04 -0.008 ±0.04 0.125 ±0.02 Protein % 2008 (Drought) 0.27 ±0.02 0.175 ±0.04 0.138 ±0.04 -0.080 ±0.05 0.103 ±0.03 2009 (Drought) 0.21 ±0.02 0.182 ±0.04 0.146 ±0.04 -0.059 ±0.04 0.129 ±0.02 2008 (Normal) 0.007 ±0.001 0.005 ±0.0012 0.004 ±0.001 0.005 ±0.001 0.002 ±0.001 2009 (Normal) validity of data set on this trait for this trial questioned by both of tests to fit additive-dominance model Tryptophan % 2008 (Drought) 0.003 ±0.0003 0.002 ±0.0006 0.002 ±0.0005 0.002 ±0.0006 0.007 ±0.0004 2009 (Drought) 0.001 ±0.0001 0.001 ±0.0002 0.0009 ±0.0002 0.0003 ±0.0003 0.001 ±0.0001 2008 (Normal) 0.034 ±0.002 0.032 ±0.005 0.024 ±0.005 0.012 ±0.005 0.049 ±0.003 2009 (Normal) 0.034 ±0.003 0.036 ±0. 006 0.027 ±0.005 0.007 ±0.006 0.067 ±0.003 Lysine % 2008 (Drought) 0.034 ±0.003 0.033 ±0.006 0.028 ±0.005 0.008 ±0.006 0.063 ±0.004 2009 (Drought) 0.030 ±0.002 0.022 ±0.005 0.017 ±0.004 0.005 ±0.005 0.021 ±0.003 D: Additive Varian H1: Dominance Variances 1, H2: Dominance Variance 2, h2: Dominance Effects (as the algebraic sum over all loci in heterozygous phase) component of variation F: Product of Additive by Dominance Effects E 0.0023 0.0003 0.0020 0.0018 0.0001 ±0.005 ±0.006 ±0.006 ±0.006 ±0.0002 0.00007 ±0.0001 0.00006 ±0.00004 0.0009 ±0.001 0.0009 ±0.001 0.0009 ±0.001 0.0011 ±0.001 E: Environmental Table 4: Second degree statistics of genetic variation for various protein quality traits in 8x8 diallel cross in maize (2008-09). Genetic Parameters Plant Characters Trials (H1/D)1/2 KD/KR h2/H2 h uv (H2/4H1) D/(D+E) h2b h2n 2008 (Normal) 0.93 0.43 0.66 -0.27 0.21 0.99 0.99 0.79 2009 (Normal) 0.96 0.49 0.88 -0.35 0.18 0.99 0.99 0.79 Protein Contents 2008 (Drought) 0.81 0.41 0.85 -0.32 0.20 0.99 0.99 0.84 2009 (Drought) 0.93 0.42 1.01 -0.36 0.20 0.99 0.99 0.80 2008 (Normal) 0.94 0.69 0.47 -0.04 0.17 0.98 0.96 0.62 2009 (Normal) validity of data set on this trait for this trial questioned by both of tests to fit additive-dominance model Tryptophan Contents 2008 (Drought) 0.95 0.68 0.64 -0.08 0.18 0.98 0.96 0.61 2009 (Drought) 0.86 0.55 1.43 -0.03 0.20 0.97 0.95 0.73 2008 (Normal) 0.96 0.60 2.35 -0.22 0.19 0.97 0.96 0.68 2009 (Normal) 0.95 0.55 2.79 -0.26 0.19 0.98 0.97 0.72 Lysine Contents 2008 (Drought) 0.98 0.56 2.55 -0.25 0.22 0.97 0.96 0.65 2009 (Drought) 0.85 0.54 0.39 -0.15 0.20 0.96 0.94 0.74 (H1/D)1/2 : Average degree of dominance. uv (H2/4H1): Balance of positive and negative genes. KD/KR: Proportion of dominant genes. D/(D+E): True sense heritability. h2/H2 : Number of effective factors. h2b: Broad sense heritability. h: Average direction of dominance. h2n: Narrow sense heritability Mozammil Hussain, et al. Breeding strategies for developing quality protein maize… 108 Tryptophan Percentage Genetic analysis of variance (Table 2) revealed effectiveness of additive and dominant genetic effects, as ‘a’ and ‘b’ items were significant (P≤0.01) in all four trials and across irrigation supplies whereas trial planted under normal irrigation during 2009 lost validity due to the presence of epistasis. Therefore, computations of the genetic components were not made for this trial. Likewise, significance of direction dominance was indicated by the significant ‘b 1’ item. Control of tryptophan contents was being influenced by different numbers of alleles asymmetrically distributed among the parents, suggested by the significant ‘b2’ item. Significant ‘b3’ item specified specific gene effects in the genetic manifestation of tryptophan content in the maize kernels. Maternal and reciprocal effects were absent altogether as ‘c’ and‘d’ item remained non-significant across all trials, unanimously. It is evident that additive and non-additive genes were effective jointly for this character. This was inferred by the significance of D, H1, H2 variances and values of h2 (Table 3). However, greater values of additive variances than for dominance put more emphasis on the additive gene effects. Value of KD/KR ratios were distributed from 0.55 to 0.69 (Table 4). Genes with positive and negative effects were asymmetrically distributed at loci exerting dominance as indicated by the (H 2/4H1) ratio values (0.17 – 0.20). Genetic component (H1/D1)1/2 accounted for a numeric ranged between 0.86-0.95 reducing dominance to the level of partial dominance. Graphic presentation clearly indicated that inheritance of tryptophan is under the control of partial dominance, as revealed by the positive intercept of the Wr-axis by the regression line (Figure 2). Distribution of array points for the parents furnished that parent NCMLD4 and NCMLD3 shared the maximum dominant alleles against NCMLQ1 which received the minimum of these alleles during 2008 under normal irrigation. Parental lines NCMLD3 and NCMLD4 interchangeably shared the maximum dominant alleles against NCMLQ 3 or NCMLQ1 which had low shares of dominant alleles in rest of the trials. This was inferred from the distribution of these inbred lines with their relative distance from the origin along the regression plot. These results are in agreement with those derived by Ngaboyisonga et al. (2008). Lysine Percentage Results of genetic analysis of variance are presented in Table 2. The presence of additive as well as non-additive genetic effects were postulated in the genetics of lysine content in maize kernels endosperm, along with the presence of directional dominance of genes at loci carrying dominant genes. These genes were asymmetrically scattered among parents. Additionally parents contained the genes for specific dominance. The above inferences were highly significant (P≤0.01). Variances for ‘a’, ‘b’, ‘b1’, ‘b2’ and ‘b3’ items were significant in all of the four trials planted under varied moisture regimes. Maternal and reciprocal effects remained absent across water stress levels except in the trial conducted under normal irrigation during 2009, wherein ‘c’ item became significant, contrary to the non-significant ‘c’ and ‘d’ items otherwise. Therefore, mean squares of ‘a’ and ‘b’ items were retested against the mean squares of ‘c’ for this year. After retesting additive effects remained unchanged, while dominance effects were already absent. Testing the validity of hypotheses revealed that the data set suited the further analysis of genetic parameters given in Table 3. These parameters showed that both additive and dominant gene actions were active in determining inheritance of lysine content in maize kernels as evidenced by the significance of D, H1, H2 and h2 values. However greater values of D than H1 and H2 in all the trials shifted the balance towards a more vital role of additive gene effects than the role of dominance. The role of additive effects was also advocated by the non-significance of F values except in the trial planted under normal irrigation during 2008. Balance of genes with positive and negative effects remained in place for asymmetry of gene distribution in the parents was shown by values (0.18 – 0.22) of (H2/4H1) ratios (Table 4). The proportion of dominant genes, KD/KR appeared between (0.54 – 0.60), imparted some role to dominance effects but negative values of ‘h’ (-0.15 to -0.25) argued against the role of dominant gene action in the genetic control of this biometric character. Average degree of dominance (H 1/D)1/2 generated values (0.85 – 0.98), suggesting partial dominance to lysine content. Sarhad J. Agric. Vol. 30, No.1, 2014 109 The same was observed in the Wr-Vr graph (Figure 3). A positive intersect to the Wr-axis by the regression line suggested partial dominance gene action. The array of points along regression line revealed that inbred lines NCMLQ4, NCMLD1 and NCMLD3 carried most dominant alleles under normal irrigation during 2008, whereas NCMLQ1 had most recessive alleles in these trials. In the drought trial for both years, parents NCMLD1 and NCMLD3 commonly shared the largest number of dominant alleles, whereas NCMLQ1 had the least in these trials as well. Partial dominance for this trait has also been reported by Irshad ul Haq (2010). CONCLUSION AND RECOMMENDATIONS It is generally thought that biochemical parameters are more fragile under biotic and abiotic stresses, and interact in a more complex manner. It may cause complexity by changing the genetic manifestations of these traits. However, in this case, the gene actions for these traits remained unchanged as were observed in normal and water stressed environments. The gene action for protein, tryptophan and lysine percentage was predominantly additive with partial dominance across different water regimes. The genetics manifested by additive effects requires schematic breeding program to raise the intensity of favorable alleles through “recurrent selection” in the target environment. Acknowledgment The authors are grateful to the National Agriculture Research Centre, Islamabad for providing seed and field resources to conduct this study. Moreover, the data presented here is part of PhD research thesis of principal author. REFERNCES AACC. 2003. Approved Methods of American Association of Cereal Chemists. Amer. Assoc. of Cereal Chemists, St. Paul, Minnesota. Bressani, R. 1992. Nutritional value of high-lysine maize in humans. In: E. T. Mertz (ed.), Quality protein maize. Am. Assoc. Cereal Chem., St. Paul, MN. GOP. 2008. Agriculture Statistics of Pakistan (District wise area and production of maize). Federal Bureau of Statistics, Islamabad, p. 16-20. GOP. 2011. Agriculture Statistics of Pakistan. Federal Bureau of Statistics, Islamabad, p. 18-19. Grant, R. F., B. S. Jackson, J. R. Kiniry and G. F. Arkin. 1989. Water deficit timing effects on yield components in maize. Agron J. 81:61-65. Hayman, B. I. 1954a. The theory and analysis of diallel crosses. Genet., 39: 789-809. Hayman, B. I. 1954b. The theory and analysis of variance of diallel tables. Biometrics. 10: 235 Huang, J. and H. Bouis. 1996. Structural changes in demand for food in Asia. Food, Agriculture and the Environment discussion. J. Agric. Econ. 8:107-120. Hussain, M., S. R. Chughtai, H. I. Javed, H. N. Malik and M. H. Munawar. 2006. Performance of locally constituted quality protein maize hybrids-a fortune for malnourished people and feed industry in Pakistan. Asian J. Plant Sci. 5(2): 385-389. Irshad ul Haq, M.2010. Genetic regulation for yield and quality attributes in maize. PhD research thesis. PMAS Arid Agric. Univ., Rawalpindi, Pakistan. Joshi, V. N., N. K. Pandia and R. B. Dubey. 1998. Heterosis and combining ability for quality and yield in early maturing single cross hybrids (Zea mays L.). Ind. J. Genet. Plant Breed. 58(4): 519-524 Kumar R. S., E. Satyanarayana and P. Shanthi. 2002. Evaluation of high oil maize (Zea mays L.) hybrids for agronomic yield and quality parameters. Proceedings of the 8 th Asian Regional Maize Workshop, Bangkok, Thailand, August 5-8, 2002. Mather, K. and J. L. Jinks. 1982. Biometrical Genetics. 3 rd ed. Chapman and Hall, London. Maydica, 37: 217-223. Moro, G. L., J. E. Habben, B. R. Hamaker and B. A. Larkins. 1996. Characterization of the variability in lysine content for normal and opaque-2 maize endosperm. Crop Sci. 36: 1651-1659. Mozammil Hussain, et al. Breeding strategies for developing quality protein maize… 110 Ngaboyisonga, C., K. Njoroge, D. Kirubi and S. M. Githiri. 2008. Effects of field conditions, low nitrogen and drought on genetic parameters of protein and tryptophan concentrations in grain of quality protein maize. Int. J. Pl. Prod. 2(2): 137-152. Paes, M. C. D. and M. H. Bicudo. 1995. Nutritional Perspectives of Quality Protein Maize.In: Proceedings of the International Symposium on Quality Protein Maize. Sete Lagoas. Larkins, (eds.) B. A. and Mertz, E. T. pp. 65-78. Pearson, D. 1976. Chemical Analysis of Foods, 7th Edition. Churchill, Livingstone: London, UK. 7-11. Pixley K.V. and M.S. Bjarnason. 2002. Stability of grain yield, endosperm modification, and protein quality of hybrid and open-pollinated quality protein maize (QPM) cultivars. Crop Sci. 42: 1882-1890. Steel, R.G.D. and J.H. Torrie. 1980. Principles and Procedures of Statistics. McGraw Hill: New York, NY. 137-169 Vivek B.S., A.F. Krivanek, N. Palacios-Rojas, S. Twumasi-Afriyie and A.O. Diallo. 2008. Breeding Quality Protein Maize (QPM): Protocols for Developing QPM Cultivars. Mexico, D.F.: CIMMYT.
