Fig. S1 Estimated ratios of plastid DNA (ptDNA) to nuclear DNA
advertisement
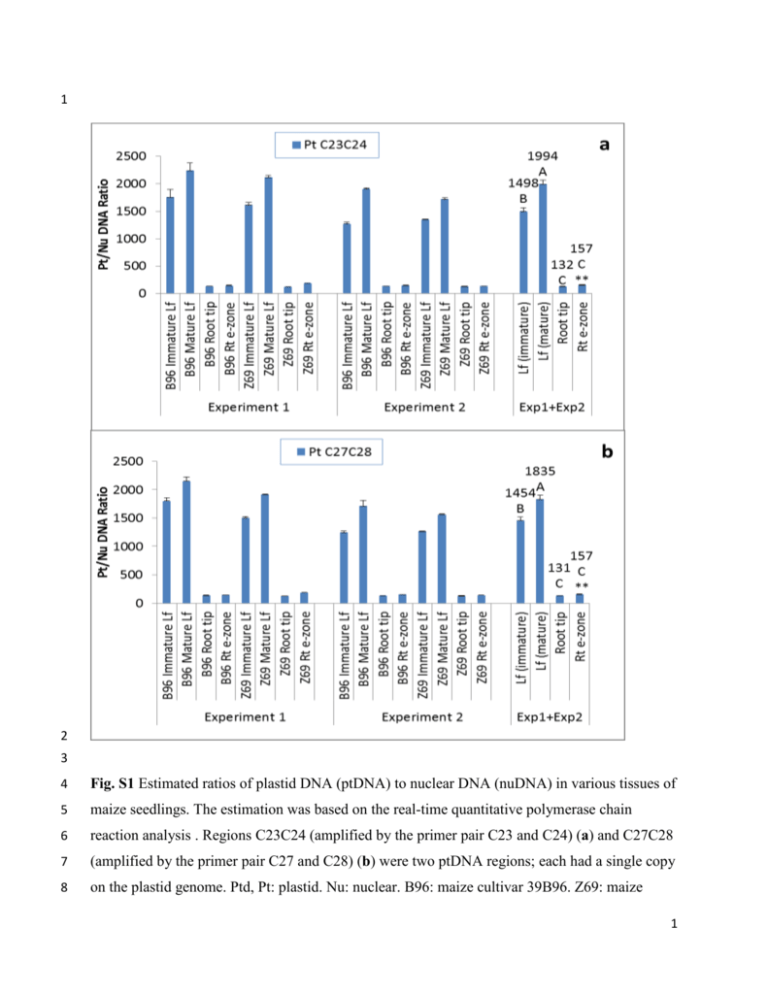
1 2 3 4 Fig. S1 Estimated ratios of plastid DNA (ptDNA) to nuclear DNA (nuDNA) in various tissues of 5 maize seedlings. The estimation was based on the real-time quantitative polymerase chain 6 reaction analysis . Regions C23C24 (amplified by the primer pair C23 and C24) (a) and C27C28 7 (amplified by the primer pair C27 and C28) (b) were two ptDNA regions; each had a single copy 8 on the plastid genome. Ptd, Pt: plastid. Nu: nuclear. B96: maize cultivar 39B96. Z69: maize 1 9 cultivar 39Z69. Lf: mainly the first true leaf of the seedlings, and in some cases the second true 10 leaf if it was also open. Root tip: the primary root tip. Rt e-zone: the primary root elongation 11 zone. Exp1: experiment 1. Exp2: experiment 2. Bars indicate standard error based on the two 12 biological experiments and the three technical repeats per experiment. In the Exp1+Exp2 13 summary area, means with the same letter are not significantly different according to factorial 14 analysis of variance and Duncan’s multiple range test. The double asterisks (**) indicate 15 difference from the root tip at the P < 0.01 level according to Student’s t-test. Note that the 16 moderately mature parts of the leaves and roots showed higher ptDNA/nuDNA ratios than did 17 the less mature parts. 18 19 2 20 21 22 23 Fig. S2 Estimated ratios of mitochondrial DNA (mtDNA) to nuclear DNA (nuDNA) in various 24 tissues of maize seedlings. The estimation was based on the real-time quantitative polymerase 25 chain reaction analysis. Regions C33C34 (amplified by the primer pair C33 and C34) (a) and 26 C35C36 (amplified by the primer pair C35 and C36) (b) were two unique mtDNA regions. Each 27 of these regions likely represented a subgenomic molecule, because their copy numbers per cell 3 28 were very different. Mt: Mitochondrial. Nu: nuclear. B96: maize cultivar 39B96. Z69: maize 29 cultivar 39Z69. Lf: mainly the first true leaf of the seedlings, and in some cases the second true 30 leaf if it was also open. Root tip: the primary root tip. Rt e-zone: the primary root elongation 31 zone. Exp1: experiment 1. Exp2: experiment 2. Bars indicate standard error based on the two 32 biological experiments and the three technical repeats per experiment. In the Exp1+Exp2 33 summary area, means with the same letter are not significantly different according to factorial 34 analysis of variance and Duncan’s multiple range test. Note that in leaves, the mature or 35 moderately mature parts showed dramatically lower mtDNA/nuDNA ratios than did the less 36 mature, light-green parts. 37 38 4


