Lecture - summary st..
advertisement
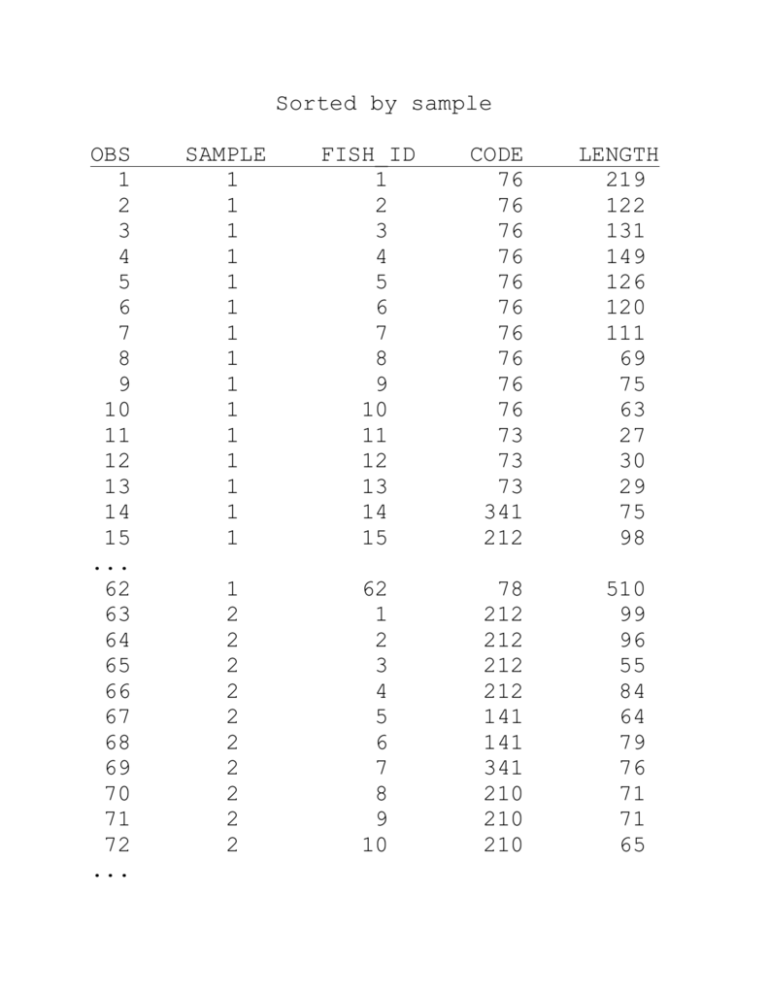
Sorted by sample OBS 1 2 3 4 5 6 7 8 9 10 11 12 13 14 15 ... 62 63 64 65 66 67 68 69 70 71 72 ... SAMPLE 1 1 1 1 1 1 1 1 1 1 1 1 1 1 1 FISH_ID 1 2 3 4 5 6 7 8 9 10 11 12 13 14 15 CODE 76 76 76 76 76 76 76 76 76 76 73 73 73 341 212 1 2 2 2 2 2 2 2 2 2 2 62 1 2 3 4 5 6 7 8 9 10 78 212 212 212 212 141 141 341 210 210 210 LENGTH 219 122 131 149 126 120 111 69 75 63 27 30 29 75 98 510 99 96 55 84 64 79 76 71 71 65 ... ... Sorted by sample and code OBS SAMPLE FISH_ID 1 1 11 2 1 12 3 1 13 4 1 1 5 1 2 6 1 3 7 1 4 8 1 5 9 1 6 10 1 7 11 1 8 12 1 9 13 1 10 14 1 62 15 1 21 16 1 22 17 1 23 18 1 24 ... 62 1 61 63 2 37 64 2 38 65 2 5 66 2 6 67 2 39 68 2 40 CODE 73 73 73 76 76 76 76 76 76 76 76 76 76 78 210 210 210 210 381 76 76 141 141 163 163 LENGTH 27 30 29 219 122 131 149 126 120 111 69 75 63 510 46 36 56 40 51 25 27 64 79 185 91 69 70 71 ... 2 2 2 8 9 10 210 210 210 71 71 65 OBS 1 2 3 4 5 6 7 8 9 10 11 12 13 14 ... 63 64 65 66 67 68 69 70 71 ... SAMPLE 1 1 1 1 1 1 1 1 1 1 1 1 1 1 2 2 2 2 2 2 2 2 2 FISH_ID 11 12 13 1 2 3 4 5 6 7 8 9 10 62 37 38 5 6 39 40 8 9 10 CODE 73 73 73 76 76 76 76 76 76 76 76 76 76 78 76 76 141 141 163 163 210 210 210 LENGTH Sample Code Mean_L 27 ----> 30 ----> 1 73 28.67 29 ----> 219 ......> 122 ......> 131 ......> 149 ......> 126 ......> 1 76 118.50 120 ......> 111 ......> 69 ......> 75 ......> 63 ......> 510 ----> 1 78 510.00 25 ----> 27 ----> 64 ......> 79 ......> 185 91 71 71 65 1 76 26.00 1 141 71.50 What to do in SAS when you have several tables that are alike, and want to join them into a single larger table? Example: bird1997 Site Maple River Maple River Maple River Maple River Maple River Maple River Maple River ... Year 1997 1997 1997 1997 1997 1997 1997 Bird_ID 1 2 3 4 5 6 7 Species Mallard Mallard Mallard BW Teal GW Teal Shoveler Mallard Distance (m) 15 35 18 25 20 05 09 Year 1998 1998 1998 1998 1998 1998 1998 Bird_ID 1 2 3 4 5 6 7 Species Robin Crow Mallard Brant Mallard Redhead Widgeon Distance (m) 18 09 01 15 20 35 10 bird1998 Site Maple River Maple River Maple River Maple River Maple River Maple River Maple River ... data bird; set bird1997 bird1998; run; Note: can “set” only up to six tables at once, and the tables must have the same structure Statistics available: PROC SUMMARY AND PROC MEANS: N Sample size NMISS Number of observations with missing (null) data MEAN Arithmetic mean STD Sample standard deviation STDERR Standard error CLM Confidence limits (need to specify alpha in procedure options) UCLM Upper confidence limit (need to specify alpha in procedure options) LCLM Lower confidence limit (need to specify alpha in procedure options) MIN Minimum MAX Maximum RANGE Range SUM Total VAR Variance USS Uncorrected sums of squares CSS Corrected sums of squares CV Coefficient of variation T t-statistic PRT Probability that observed t-statistic or greater would occur under null hypothesis that mean=0) SKEWNESS Skewness KURTOSIS Kurtosis PROC UNIVARIATE ALSO ALLOWS YOU TO: NORMAL Test statistic for normality SIGNRANK Test statistic for sign rank Px Allows you to calculate any percentile from the data (e.g., 95 percentile) Q1 Lower quartile Q3 Upper quartile QRANGE Difference between upper and lower quartiles MSIGN Sign statistic PROBN Probability that data comes from normal distribution PROBM Probability for sign statistic PROBS Probability for signed-rank statistic
