Humidity variables
advertisement
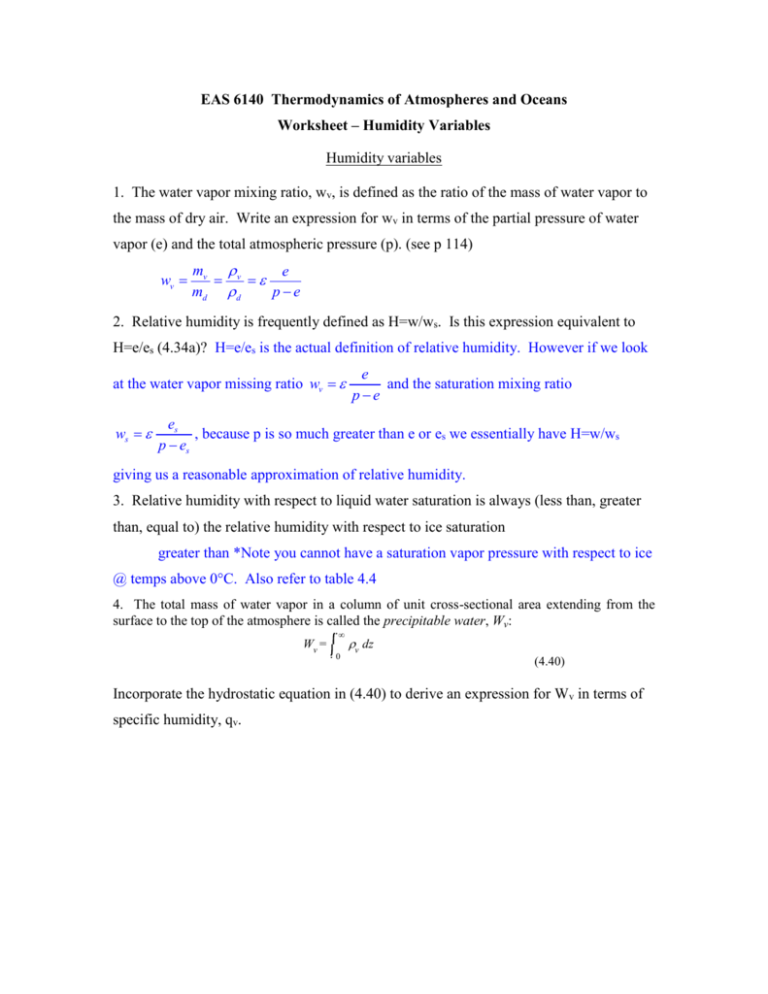
EAS 6140 Thermodynamics of Atmospheres and Oceans Worksheet – Humidity Variables Humidity variables 1. The water vapor mixing ratio, wv, is defined as the ratio of the mass of water vapor to the mass of dry air. Write an expression for wv in terms of the partial pressure of water vapor (e) and the total atmospheric pressure (p). (see p 114) wv mv v e md d pe 2. Relative humidity is frequently defined as H=w/ws. Is this expression equivalent to H=e/es (4.34a)? H=e/es is the actual definition of relative humidity. However if we look at the water vapor missing ratio wv ws e and the saturation mixing ratio pe es , because p is so much greater than e or es we essentially have H=w/ws p es giving us a reasonable approximation of relative humidity. 3. Relative humidity with respect to liquid water saturation is always (less than, greater than, equal to) the relative humidity with respect to ice saturation greater than *Note you cannot have a saturation vapor pressure with respect to ice @ temps above 0°C. Also refer to table 4.4 4. The total mass of water vapor in a column of unit cross-sectional area extending from the surface to the top of the atmosphere is called the precipitable water, Wv: W = dz v 0 v (4.40) Incorporate the hydrostatic equation in (4.40) to derive an expression for Wv in terms of specific humidity, qv. Wv v dz 0 Wv v 0 Wv dz p g dp g 1 p v dp g po 1 po v dp a a d v g p mv v 1 po v Wv dp wv qv g p d v mv md v d Wv Wv 1 po qv dp g p 5. Write the SI units for each of the following parameters relative humidity____no units_________ water vapor mixing ratio___no units_________ specific humidity ____no units_______ precipitable water ____kg/m2________ 6. Air at 50oC with RH=10% contains (more, less) water vapor than air at -10oC with RH=100%. (Hint: es=123.39 hPa at 50oC; es=2.8622 hPa at -10oC.) 50oC 10% * 123.39 = 12.3 12.3 > 2.86 -10oC 1005 * 2.8622 = 2.86 7. An air mass has a temperature of 30°C and a relative humidity of 50% at a pressure of 1000 hPa. Determine the following: (note: you may use Appendix E for values of es. In Appendix E, ew corresponds to es) a) water vapor partial pressure H e es .5 e 42.427hPa b) mixing ratio e 21.21hPa wv m e v 0.622 pe md 21.21hPa wv 0.622 0.0135 1000hPa 21.21hPa c) specific humidity qv wv 0.0135 0.0133 1 wv 1 0.0135 d) virtual temperature Tv (1 0.608qv )T Tv (1 0.608*0.0133)303K 305.45 K or 32.45C Thermodynamic Charts Using the Stuve (or Skew-T) diagram, read off the temperature and determine the potential temperature at each of the following levels Level MAF sounding T MFL sounding T 27°C 300.15K 900 mb 20°C 302.12 K 20°C 302.12K 700 mb 10°C 313.6K 6.5°C 309.7K 500 mb -6°C -7°C 1000 mb 325.7 K 324.5K Estimate dT/dz and d/dz for the following layers Level MAF sounding T 1000-900 mb MFL sounding T -10.2°C/km 2.87°C/km 700-500 mb -4.98°C/km -5.9°C/km -4.47°C/km 5.46°C/km Determine the change in T and of an air parcel initially at 900 mb if subjected to MAF sounding MFL sounding T T a. adiabatic lifting of 100 mb -10 0 -10 0 b. adiabatic lowering of 100 mb 10 0 10 0 c. radiative heating of 10oC 10 10 10 10 d. radiative cooling of 10oC -10 -10 -10 -10 Sketch the following paths on the MFL diagram a) A parcel of air is lifted dry adiabatically from an initial height of 900 mb to a height of 700 mb. The parcel is then lowered back down to the initial pressure. Label this path A. Is this path reversible? Yes this is a reversible process. Although latent heat will positively change the temperature of the parcel the parcel does not loose any condensate or heat to the environment. This is essentially why this process is reversible. As long as we are not losing mass or heat you should consider the process to be reversible. Other processes that are irreversible include radiative heating and cooling, and mixing. This answer should also help for part b. b) A parcel of air is lifted dry adiabatically from an initial height of 900 mb to a height of 700 mb. The parcel is then heated radiatively by 10oC at constant pressure. The parcel is then lowered back down to the initial pressure. Label this path B. Is this path reversible? No. Use the Stuve (or Skew-T) diagram to answer the following questions. Lines of constant water vapor mixing ratio are given by the red dashed line (with scale on the x axis). The vertical profile indicated by the curve left of the temperature curve represents the profile of dew point temperatures. The dew-point temperature, denoted by TD, is defined by wv =ws TD (6.15) So the dew point temperature is a humidity variable that is directly related to the mixing ratio. The dewpoint depression is defined as T-TD. Fill in the table below for the MAF sounding, by answering the following questions for each of the indicated levels Level w 1000 TD T-TD ws RH (Air parcel begins @ a pressure < 1000mb) 850 12.5g/kg 14.5 20-14.5 19g/kg 12.5/19 700 7.5g/kg 4.5 10-4.5 12g/kg 7.5/12 4 00 (Not able to determine exact values with skew t) Which layers are most likely to have clouds? None have 100% humidity; we shouldn’t expect any clouds. However the 900-850 mb and @ 650mb are the layers with the highest RH. You can determine this by the spacing between the dewpoint curve and the temperature curve. Fill in the table below for the MFL sounding, by answering the following questions for each of the indicated levels Level w TD T-TD ws RH 1000 18g/kg 23 27-23 24g/kg 18/24 850 14g/kg 16 16-16 14g/kg 14/14 700 9.5g/kg 6.5 6.5-6.5 9.5g/kg 9.5/9.5 4 00 Which layers are most likely to have clouds? Layers @ 850 and 700 mb
