flow dense
advertisement
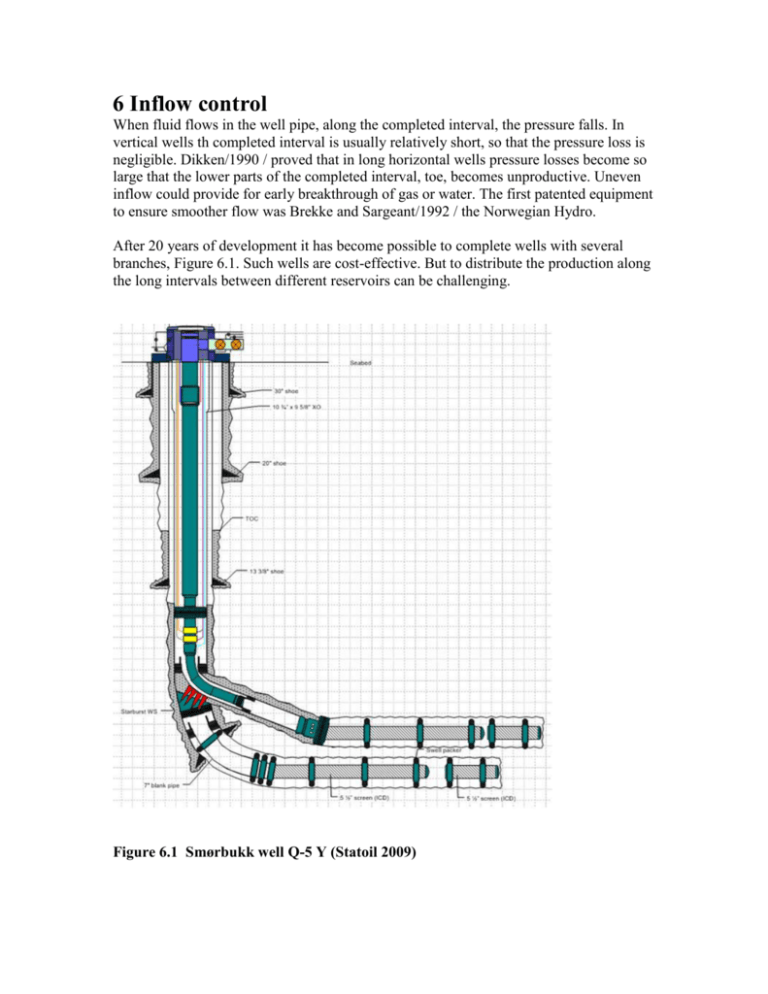
6 Inflow control When fluid flows in the well pipe, along the completed interval, the pressure falls. In vertical wells th completed interval is usually relatively short, so that the pressure loss is negligible. Dikken/1990 / proved that in long horizontal wells pressure losses become so large that the lower parts of the completed interval, toe, becomes unproductive. Uneven inflow could provide for early breakthrough of gas or water. The first patented equipment to ensure smoother flow was Brekke and Sargeant/1992 / the Norwegian Hydro. After 20 years of development it has become possible to complete wells with several branches, Figure 6.1. Such wells are cost-effective. But to distribute the production along the long intervals between different reservoirs can be challenging. Figure 6.1 Smørbukk well Q-5 Y (Statoil 2009) In this chapter we review the principles and equipment for flow control that is in common use in 2011. There is considerable effort in development and new and improved equipment. The basic principles are hopefully more durable, but it seems to be plenty of challenges in the completion design, production monitoring, optimization and robustness. 6.1 Basic principles Objectives: identify the interaction between flow and flow in the well 6.1.1 Flow from the reservoir to the well The flow in the well will be zero where the completed interval begins (toe). At the end (heel) the flow equals total production from the well. Along the completed interval, the flow in the well pipe will increase as illustrated Figure 6.2 Flow towards and flow along the completed interval Inflow per unit length is usually called the inflow density: qL. Volume balance (continuity relation) connects the inflow density to flow : Q along the well qL Qi 1 Qi x x 0 dQ dx (6-1) Darcy's law implies that the inflow density is proportional to the pressure difference between reservoir and well. Proportionality factor: jL, is called specific productivity index and can be understood as the productivity index per meter well qL jL pR pw x (6-2) Productivity index is traditionally defined as the ratio between total production and pressure drop from the reservoir to the well. Production is traditionally measured by standard rate: qo, which can be converted to total downhole rate by multiplying by the formation factor: Q = qoBo. Productivity index is derived preferably from Darcy's law by assuming homogenous inflow along the well. Total production corresponds to the product of flow density and completed the well length. The relationship between specific and total productivity index is then jL J Bo Lw (6-3) The relation (6-3) assumes that the flow is perpendicular to the well. With pressure drop along the well, this will not be quite correct, however, an acceptable approximation if the flow resistance from the reservoir to the well is much larger than the flow resistance along the well. Usually this will be the case. 6.1.2 Flow along the well Pressure gradient along a horizontal well can be estimated with the common pipe flow equation. Based on the flow, this dpw 2 8 f 2 5 Qx dx d (6-4) If the density is constant and the pressure is related to the reference height (hydraulic potential), the (6-4) also apply to inclined and vertical wells. 6.1.3 Coupling between inflow and flow in the well The flow velocity along the completed interval. Within the same reservoir, pressure at the reference height is considered constant: dpR / dx = 0 By setting (6-1), (6-2) into (6-4), we get the relationship between flow and flow d 2Q 2 j L 8 f 2 5 Q x 2 dx d (6-5) In simple cases this can be handled analytically. We then multiply (6-5) with qL=dQ/dx and applying the relationship: 2 2 dQ / dx d and. dQ dx Q 2 1 3 dQ 3 dx Q / dx 1 2 d dx dQ dx . At the bottom of the well will flow to zero: Q (0) = 0 We obtain after integration dQ 16 f 2 3 qL xo jL Q x 2 5 dx 3 d (6-6) Inflow density at the toe: qL(xo) is unknown. If the well is sufficiently long the inflow density at the toe to zero, Dikken/1990 /. More generally, (6-6) may be integrated numerically along the completed interval. By trial and error can we find the inflow density at the toe so that the flow at the heel corresponds to total production. Figure 6.2 shows the flow and pressure calculated for Scenario 1, Table 6.1 Figure 6.2: Pressure an inflow along the well The figures show much greater flow density at the heel than the toe. The well pipe deliberately chosen small so that the speed at 6 m / s at the heel. Larger pipe diameters would provide less pressure drop along this and more even inflow from the reservoir. Table 6.1: Scenario 1 Reservoir Pressure 200 bar Specific productivity index: j = 0.1m3/d/bar, Production Qt = 1000 m3 / d Oil density 800 kg/m3. Viscosity 1 cP Inner diameter, production pipe: d = 50 mm 6.2 Homogeneous flow In a homogeneous reservoir without pressure drop along the well, the inflow along the completed interval will be homogeneous. If the pressure loss along the well is much smaller than the pressure loss from the reservoir to the well, the inflow may be approximately homogeneous. Below we shall examine where this is an acceptable simplification. With flow control homogeneous flow is often a goal. Press and rates estimated for homogeneous flow therefore provides the necessary basis to select and dimension the flow control valves. 6.2.1 Pressure in the well pipe and the sand face With the constant influx density, the volume flow increase steadily along the completed interval: . Qx qL x . By integrating (6-4) along the well pipe, we get the pressure drop pw 8 2 f 2 5 qL L3 3 d (6-7) From (6-2), we get the pressure drop from the reservoir to the sand face p R pw 1 qL jL (6-8) Figure 6.4 shows the pressure in the well wall and the well pipe calculated for Scenario 1, when production: Qt = 1000 Sm3 / d and the inflow homogeneous . Without flow control, pressure in the well wall and the well pipe will be equal. The figure shows negligible pressure difference between the well wall and the well pipe the first 300 meters. Further, the pressure in the well pipe to fall significantly below the pressure in the well wall, thus violating the assumption of homogeneous flow Figure 6.4 Pressure in the well wall and well, with homogeneous flow 6.2.2 Criterion for homogeneous flow We will consider the inflow almost homogeneous if the difference in flow resistance between the toe and heel: ,, is small compared to the average inflow qL jpw density: qL Qt Lw . . This provides the criterion qL qL , With no flow at the beginning of the interval, ie starting from the toe, the criterion can be developed as j 8 f 2 5 Qt L2 3 d (6-9) This makes it possible to examine whether the influx of a potential well is nearly homogeneous. The difference is debatable, but the range: 0.05 0.1 , may seem acceptable 6.3 Completion and equipment 6.3.1 Completion for inflow control Figure 6.5 shows completions with inflow control. The influx from the reservoir enters the annulus. Inflow from the annulus to the well pipe is through valves Figure 6.5 Completion Annular packers restricts the flow along the annulus and separate reservoir sections with different properties. These annular packers have polymer seals that swell up when they come into contact with oil. Well pipe are screwed together by standard lengths (12 feet, 40 feet). All or some of these are equipped with a sand screen and inflow control, Figure 6.6 Figure 6.6 Well tubular med sand screen and ICD (Reslink /2007/) The sand screen can be made up of metal profiles, or fabrics woven from wire. One problem is that holes may be in the screen if the local flow speed becomes large, for example after gas breakthrough. Inflow Control can even out the inflow and thereby reduce the risk of local erosion. Inflow Control (ICD = "inflow Control Device") consists of valves with housing to protect them. Control valves distribute the inflow as desirable. They should be mechanically durable and also function according to intention also if the reservoir and fluid properties differ from the expected, or change over time. 6.3.2 Static control valves Figure 6.7 shows a photograph of a control, cut open. Part of the sand screen is seen to the left. We see three nozzles inserted in the pipe wall. These are made of extra hard material Figure 6.7 Inflow control device (ICD) (ResLink /2007/) Assuming that the velocity energy is dispersed after the nozzle, the pressure loss becomes: 2 pc 0.5 vc With distance Lc, between control units, the flow to each unit becomes: : Qc qL Lc . With nc nozzles, each with effective cross-sectional area: Ac, the valve characteristics becomes 2 1 L pc c qL2 2 nc Ac (6-10) Figure 6.8 illustrates friction pipes for inflow control. Small Reynolds number (Re <2500) implies laminate flow, so that the friction factor is proportional to the viscosity: f=64/v2, and pressure loss is proportional to the flow: At high Reynolds number is the p c ~ q L friction factor is almost constant and the pressure loss is proportional to the squared flow, 2 pc ~ qL ie similar to nozzles. Figure 6.8 Inflow control by friction pipes (Halliburton /2010/) By adding the pressure drops due to wall friction and momentum loss, we obtain the valve characteristic below. It is here assumed nf friction pipes, each of length: lf L 1 l pc f f 1 c 2 d n f A f 2 2 qL (6-11) Figure 6.9 shows the characteristics of nozzles (6-10) and friction pipes (6-11), for "water" with density 1000 kg/m3, viscosity: 1cP; and "oil" with density 800 kg/m3 and viscosity: 10 cP. Valve parameters are listed Table 6.2 below Table 6.2 Parametres Diameter Number Lengths Dictance between LCD’s Nozzles dc=3 mm nc= 3 ….. Lc = 12 m Friction pipes df=5 mm nf= 6 lf=1m Lc = 12 m Figure 6.9 Comparison of valve characteristics The figure shows that with our viscous oil, the characteristics of friction pipe ICD becomes approximately linear. The flow through the nozzles will be unaffected by viscosity, unless this is very large. Changing from oil to water, the flow through friction pipes increases, while the flow through nozzle-based inflow control will decrease somewhat. 6.3.3 Dynamic control valves Valves with parts that change position without control from outside will be call dynamic. The purpose may be to close after breakthrough of gas, or water. At present, dynamic valve are applied on the pilot level. There is little reported experience with these. Bernoulli valves According to Bernoulli the pressure will decrease when the flow velocity increases. Such pressure changes provide forces that can be used to open / close valves. Figure 6.10 illustrates the Bernoullivalve developed by Norsk Hydro and tried on the Troll field Halvorsen & al /2012/ Figure 6.10 Cross section through Bernoulli valve Figure 6.11 below are based on measurements provided in the patent application, Aakre & Mathiesen/2008 /. Measurements up to flow "4" (units were not given) have been adapted to the choke equation (6-10) and extrapolated further. This indicates choke characteristics up to a limit. Above, the pressure difference may increase without providing greater throughput Figure 6.11 Comparison between Bernoulli valve and fixed choke Buoyancy-controlled valve There are valve prototypes with floats that raise in water but sink in oil, such that the valve will block water. Osmosis-controlled valve Another concept is to allow the osmotic pressure to open and close the valve. 6.3.4 Steerable valves These are valves that can be controlled from the surface. This provides flexibility to deal with unforeseen developments. The reliability of such valve systems have in recent years has been increasing compared to the systems were installed in the 90's. The valve, with power supply and control systems, occupies space down hole. It therefore seems most relevant to use a few controllable valves to control the production from the well branches. For subsea wells, controllable valves may contribute to 2 to 5% of the total well cost, significant, but hardly a deterrent. Figure 6.1, at the beginning of the chapter illustrates a completion in which a controllable valve (shown in yellow) to allocate production from two separate wells branches. Each well branch is also equipped with passive inflow control to distribute the inflow and flow along the completed intervals Since the cost of drilling from the sea floor down to the reservoir is significant, the drilling of several branches in the reservoir attractive. Often the availability of slots is limited. With branched wells and inflow control separate reservoirs may be produced from the same well slot. 6.4 Inflow performance with pressure drop along the well Objectives: How the flow friction and flow control affects productivity The inflow performance is as relationship between the well pressure and total production. When the flow follows Darcy's law and the well pressure is constant, the inflow performance becomes linear. When the pressure drops along the completed interval, it is logical to consider the pressure at the heel, where the flow corresponds to the total production and the well pressure provides tubing inlet pressure. 6.4.1 Without inflow control Without flow control, the pressure at the heel may be computed from (6-2) and (6-6). This gives the relationship between the well pressure and total production pwt pR 1 jL qL xo jL 2 16 f Qt3 2 5 3 d (6-12) 6.4.2 With flow control With inflow control to achieve homogeneous flow , the pressure in the well pipe made (67). From this follows the flow characteristics pwt pR 1 8 Qt f 2 5 LwQt2 jL Lw 3 d (6-13) The linear contribution of (6-13) represents the pressure drop between the reservoir and the wellbore wall, while the square represents the pressure drop along the well pipe. Figure 6.13 below compares the inflow characteristics. The starting point is well Scenario 1 Figure 6.13 Inflow performances Mathematically the inflow characteristics of (6-13) is similar to that based on Forcheimer's equation. Based on measurements of flow characteristics alone, it will therefore be difficult to distinguish between turbulent inflow and friction loss along the well pipe. 6.5 Robustness Objectives: Completions which also are efficient when conditions change Before the well is put into production the knowledge of the reservoir is inadequate. During production, the properties change. Completion should be robust for changes that can reasonably be expected. 6.5.1 Optimal and robust selection of choke size Given a completed interval as illustrated below, and provided production rate, we can estimate choke sizes so that the inflow density is constant. The question then becomes how these will work when the rate of change Figur 6.14 Homogen innstrømning With homogeneous flow, the sand face pressure is constant. The pressure difference between the well wall and the well pipe is due to friction along the well pipe and must be compensated by the pressure drop across the nozzles. If we at the toe assumes the same pressure at sand face and in the pipe, then p x pc x Pressure loss along the well pipe can be expressed by (6-7) and pressure drop across the nozzles at the (6-10). Combination of relations gives 0.5 Lc 0.75 x d c x 1.31 d 2.5 nc f 0.5 (6-14) Figure 6.15 shows choke diametres that ensure homogeneous flow, calculated from for Well Scenario 1. More interesting is that neither the reservoir pressure, productivity index, density, or production rate are included in (6-14). The chokes will thus ensure uniform flow even if these variables change Figure 6.15 Optimal choke size 6.5.2 Robustness to gas breakthrough Gas is less dense than the oil at reservoir conditions and much less viscous. From Darcy's follow the flow density is proportional to the specific productivity index and the pressure loss: qL jL pR pw . Productivity index is independent of density, but inversely proportional to viscosity, so that the pressure loss from the reservoir to the wellbore wall is proportional to and the viscosity ratio: pR aqL , where a=1/(jL -10) pc bq , where b 0.5Lc nc Ac , expressed as: independent of whether oil or gas flows through. The pressure loss from the reservoir to the well pipe and through the nozzles can then be expressed 2 L 2 Gas is less dense than the oil at reservoir conditions and much lower viscosity. If the flow through the reservoir is controlled a Darcy's law, the pressure drop from the reservoir to the wellbore wall proportional to rate and viscosity pR aqL (parameter: a represents rock parameters and can be considered constant ). Pressure loss through the nozzles follow from (6-10). The sum of these gives the pressure loss from the reservoir to the well pipe pR p p aqL bqL2 (6-16) By gas breakthrough the viscosity falls, so that the pressure loss through the reservoir: decreases and the flow rate may increase. Pressure loss through the nozzles is proportional to the squared rate, so when the rate increases, the pressure loss increases relatively more. Choke based flow control will therefore reduce local inflow of gas, relative to inflow without control. Thus it makes the well more robust with respect to gas breakthrough. Bernoulli valves are assumed to limit the flow regardless of pressure difference. Inflow control by Bernoulli valves would should therefore make the well robust to local gas breakthrough. 6.5.3 Robustness to water breakthrough Fresh water has density close to 1000 kg/m3. Reservoir waters usually have slightly larger density, due to dissolved salt. Oil density is usually smaller than water and density considerably less than gas. The viscosity of water will be close to 1 cP, while the oil viscosity can be anything from somewhat less to much larger. Viscosity and density will affect the pressure loss through the reservoir and valves as expressed by (6-15) above. Simple estimates regarding the robustness can be made accordingly. Bernoulli valves may prevent the water flow exceeds a maximum rate. Valves with floaters have the potential to make wells robust to water breakthrough. The concept of osmosis control is interesting but currently more incomplete. 6.5.4 Constant choke size A simple form of flow control is to select constant choke size along the completed interval. Since the pressure loss through the nozzles is proportional to flow squared, this prevents large local influx that could trigger sand production and damage sand screens. Figure 6.16 shows the flow distribution calculated for Well Scenario 1, Table 6.1 above, with constant tip size along the completed interval (dc = 1.5 mm, nc = 3, Lc = 12 m). Figur 6.16 Innstrømning med like kontrollventiler langs komplettert intervall Pressure drop and flow for Well Scenario 1, without flow control, was previously illustrated in Figure 6.2. Comparison between Figures 6.2 and 6.16 shows that the constant choke size provides a smoother flow along the completed interval, but slightly reduces the discharge pressure at the heel 6.6 Flow in the annulus Objectives: The importance of the annulus as the flow channel If the annulus is not packed sand, or clogging by fines, it will pose a potential flow channel. Local flow towards the well will be different from the inflow. This makes inflow control is more complicated and unpredictable in that the conditions in the annulus will be somewhat unpredictable and difficult to measure. Open annulus makes flow resistance less and this can be beneficial. 6.6.1 Flow Relationships Figure 6.17 illustrates the flow in the annulus and the well pipe. When the flow is distributed between the annulus and the well pipe, the relationship between pressure and flow becomes pw p R 1 qw q p jL (6-16) The influx to the annulus is here denoted: qw, while the inflow to the production pipe is called: qp. Figure 6.17: flow and flow in the annulus and well With the control valves with choke characteristics (6-10), the relationship between pressure and flow between the annulus and the well pipe becomes p p pw 1 Cc q p q p 2 (6-17) The pressure gradient along the well pipe relates to the flow as by (6-4) re-written below dp p dx C p Q p2 (6-18) The pressure gradient along the annulus can similarly be linked to the flow dpw 2 C wQw dx (6-19) The coefficient: Cw depends on the geometry and flow resistance. A crucial question will be the amount of solids in the annulus. 6.6.2 With optimum flow control We have previously shown that the homogeneous inflow can be achieved by sizing of control valves. Along uniform reservoir sections, this means constant pressure along the wellbore wall, ie no pressure gradient and no flow along the annulus. Optimal flow control thus prevents flow in the annulus. With deviation from optimal conditions, flow may occur in the annulus. How much depends on flow resistance in the annulus. 6.6.3 Effect of flow in the annulus Figure 6.18 illustrates the pressure and flow in the annulus and the well pipe calculated for Well Scenario 2, Table 6.3 (corresponding to scenario 1, but with an open annulus). The flow along the annulus makes the total pressure drop less and the flow then more evenly distributed. At the heel the annulus closed, so the flow to is forced into the production pipe. Figur 6.18: Trykk og strømning med åpent ringrom Table 6.3: Well Scenario 2 Reservoir pressure pR = 200 bar Specific productivity index j = 0.1m3/d/bar, Production Qt = 1000 m3 / d Oil density 800 kg/m3. Viscosity 1 cP Inner diameter production pipe: d = 50 mm Number of nozzles in ICD: nc = 3 Largest nozzle diameter dc,max = 1.5 millimeter Outer diameter production tubing: 60 millimeters Well diameter: dw = 200 mm 6.7 Well Maintenance Objectives: Opportunities for maintaining the long-completed interval In vertical wells casing is usually set and cemented through the producing interval. It is common with the tail pipe hanging below the production packer. The well below the perforations constitutes a sump where the sand and sediments can be accumulate. In horizontal wells, there will not be similar sumps. The flow speed will be zero at the toe and gradually increase towards the heel. In parts of the well pipe it will be so small that the sediments can accumulate. It may therefore be necessary to intervene to remove sand and perform other well maintenance. It is not possible to reach down into horizontal sections with conventional wireline technologies. Coiled tubings can be used, but requires heavy surface equipment. Easier maintenance can be performed with an electrically driven cable tractor to pull the equipment through the well pipe. Today's tractors, Figure 6.19, provides traction around 9000 N. Figure 6.19 Cable Tractor (Aker Solutions/2010 /) Figure 6.20 shows the cable tractor with equipment for milling and hole opening. There is also equipment for sand removal, opening / closing of sliding sleeved, scale removal of valves and other operations. In practice, it is difficult, costly and risky to intervene in long horizontal wells and wells with several branches. When planning an attempt to account for any future situations that may occur and the necessary interventions, ie, think of all the well's life. Figure 6.20 Cable tractor, fitted for milling (Aker solutins 2010) Referanser 1990 Dikken, B.: ”Pressure Drop in Horizontal Wells and its Effects on their Production Performance” JPT, Nov. 1990, 1426 1992 Brekke, K. og Sargeant, J.P. : “Fremgangsmåte og produksjonsrør for produksjon av olje eller gass fra et olje- eller gassreservoar.” Patent No 306127, Innlevert 18.09.1992 1997 Asheim, H. & Oudeman, P.: “Determination of Perforation Schemes to Control Production and Injection Profiles along Horrizontal Wells” SPE Drilling & Completion, March 1997, 13 2008 Aakre, H. & Mathiesen, V.: “Method for flow control and autonomous valve or flow control device” World Intellectual Property Property Organization, WO 2008/004875 A1 2010 Aker Solutions, produktinformasjon www.akersolutions.com/wellservice 2011 Mathiesen, V., Aakre, H., Werswick, R., Elseth,. G.:“The Autonomous RCP Valve - New Technology for Inflow Control in Horizontal Wells” SPE 145737SPE Offshore O&G Conf. & Exib., Aberdeen UK, 6-8 September 2011 2012 Halvorsen, M., Elseth, G., Nævdahl, O.,M.: “Increased oil production at Troll by autonomous inflow control with RCP valves.” SPE annual, San Antonio, TX, 8-10 Oct. 2012
