Weather
More
Unit 2
More about the major wind systems,the Southern
Oscillation Index and the North Atlantic Oscillation
The different warming of our planet depending on
the latitude and the allocation of water and
land is the driving engine of the wind systems of
our planet Earth. Monsoons and trade winds are
examples of two such systems.
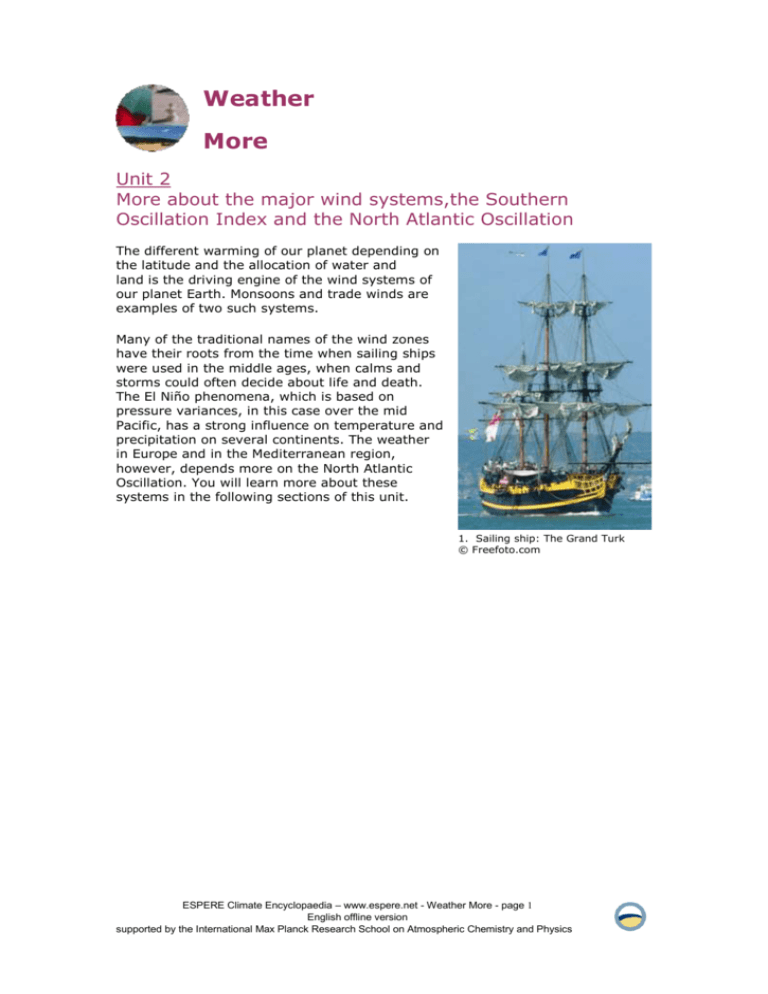
Many of the traditional names of the wind zones
have their roots from the time when sailing ships
were used in the middle ages, when calms and
storms could often decide about life and death.
The El Niño phenomena, which is based on
pressure variances, in this case over the mid
Pacific, has a strong influence on temperature and
precipitation on several continents. The weather
in Europe and in the Mediterranean region,
however, depends more on the North Atlantic
Oscillation. You will learn more about these
systems in the following sections of this unit.
1. Sailing ship: The Grand Turk
© Freefoto.com
ESPERE Climate Encyclopaedia – www.espere.net - Weather More - page 1
English offline version
supported by the International Max Planck Research School on Atmospheric Chemistry and Physics
Part 1: Major wind systems
Major wind systems, the trade winds, monsoons
Major wind systems
The incident solar radiation, the distribution of the continents and the
oceans, the rotation of the Earth and the land elevation all affect the
climate. Most of the solar radiation falls in the Equatorial region. Just
slightly to the north of the equator is a region of low winds known as the
doldrums. These occur between two windy regions where the trade
winds blow.
1. Rotating Earth - Global Circulation
The large amount of solar radiation
that arrives at the Earths
surface around the Equator
causes intense heating of the land and
the ocean. This heating causes warm
moist air to rise into the atmosphere
leaving an area of low pressure
underneath. The region is also
characterised by cloudiness, high
humidity, light and variable winds and
various forms of severe weather
including thunderstorms and
hurricanes. The doldrums are also
noted for calms, these are periods
when the winds fall, trapping sailing
boats for days.
Source: website of University of Michigan-Ann
Arbor, Department of Geological Sciences
The air that rises around the Equator
cools and descends over the so called
horse latitudes. These are two belts of
latitude where the winds are light and
the weather is hot and dry. They are
located mostly over the oceans, at
about 30° latitude in each
hemisphere. They have a north-south
range of about 5° as they follow the
seasonal migration of the Sun.
Once the descending air reaches the surface of the Earth, it spreads out towards
the Equator as part of the prevailing trade winds or towards the poles as part of
the westerlies. This region in the northern hemisphere is sometimes called the
‘calms of Cancer’ and called the ‘calms of Capricorn’ in the southern hemisphere.
The horse latitudes supposedly get their name from the days when Spanish
sailing vessels transported horses to the West Indies. Ships would often become
becalmed in mid-ocean at this latitude, thus severely prolonging the voyage. The
resulting water shortages would make it necessary for crews to throw their horses
overboard.
ESPERE Climate Encyclopaedia – www.espere.net - Weather More - page 2
English offline version
supported by the International Max Planck Research School on Atmospheric Chemistry and Physics
Trade winds
The air at doldrums rises high over the
Earth, recirculates poleward, and sinks back
toward the Earth’s surface at the horse
latitudes. Surface air from the horse
latitudes that moves back towards the
equator is deflected by the Coriolis Force.
This causes the winds to blow from the
north-east in the northern hemisphere and
from the south-east in the southern
hemispehre. These winds are known as the
trade winds. In both hemispheres,
therefore, these winds tend to blow from the
east to the west and towards the
equator. Sometimes the trade winds are
just called "easterlies" to avoid having to
specify the hemisphere. These steady winds
are called the trade winds because they
provided trade ships with an ocean route to
the New World.
2. Global Circulation
source: San Francisco State University
(SFSU) website
Monsoons
3. Effect in the Indian sub-continent - Monsoon
© 1996 EarthBase/Liaison Agency. All rights
reserved.
Photo by Chip Hires
A monsoon circulation is determined by
the different heat capacity
characteristics of continents and
oceans. They are similar to sea and
land breezes but occur over much larger
areas. In summer, the winds usually
flow from the water to the land, causing
heavy rains inland. In winter, the winds
usually reverse and the wind flows from
the land to the sea resulting in dry
conditions.
The word "monsoon" is derived from the
Arabic word "mausim" which means
season. Ancient traders sailing in the
Indian Ocean and adjoining Arabian Sea
used it to describe a system of
alternating winds, which blow
persistently from the northeast during
the northern winter and from the
opposite direction, the southwest, during
the northern summer. Thus the term
monsoon actually refers solely to a
seasonal wind shift and not to
precipitation.
ESPERE Climate Encyclopaedia – www.espere.net - Weather More - page 3
English offline version
supported by the International Max Planck Research School on Atmospheric Chemistry and Physics
Even though the term monsoon was originally
defined for the Indian subcontinent, monsoon
circulations exist in other locations of the world as
well, such as in Europe, Africa, Australia, and the
west coasts of Chile and the United States.
Approximately 65 % of the world’s population
lives within monsoon regions. The most famous
monsoon circulation occurs over India and
southeast Asia. During the summer, the air over
the continent becomes much warmer than the
water surface, so the surface air moves from the
water to the land. The humid air from the water
converges with dry air from over the continent
and produces precipitation over the region.
Additional lifting from hills and mountains causes
copious amounts of precipitation to occur, over
400 inches at some locations! During the winter
the flow reverses and the dominant surface flow
moves from the land to the water.
The Indian summer monsoon typically lasts from
June through September. During this period large
areas of western and central India receive more
than 90% of their total annual rainfall, while
4. Monsoon Circulation
southern and northwestern India receive 50%source: Homepage of the
75% of their total annual rainfall. Overall,
Cooperative Institute for Mesoscale
monthly rainfall totals average 200-300 mm, with Meteorological Studies
the largest values observed during the heart of
the monsoon season in July and August.
Rainfall across southeastern Asia is also monsoonal in nature, with the largest
totals typically observed during May-September. Area-average totals normally
reach 200 mm in each of these months, with seasonal totals of 1000 mm
commonly observed.
Part 2: El Niño and SOI
The Southern Oscillation and El Niño
Southern Oscillation
The fluctuations in ocean temperatures during El Niño and La Niña events
are linked to even larger-scale fluctuations in air pressure between the
western and eastern tropical Pacific known as the Southern Oscillation.
ESPERE Climate Encyclopaedia – www.espere.net - Weather More - page 4
English offline version
supported by the International Max Planck Research School on Atmospheric Chemistry and Physics
The Southern Oscillation is a
change in air pressure measured in
the Pacific Ocean between Tahiti in
the east and Darwin, Australia in
the west. When the pressure is
high at Darwin, it is low at Tahiti
and vice versa.
El Niño, and its sister event "La
1. Map of the South Pacific, showing Darwin in
Niña" represent the opposite
Australia and Tahiti, one of the Pacific Islands
extreme phases of the Southern
Oscillation. During El Niño events
higher than average air pressure
covers Indonesia and the western
tropical Pacific and below average
air pressure covers the eastern
tropical Pacific.
These pressure departures are reversed during La Niña, which features belowaverage air pressure over Indonesia and the western tropical Pacific and aboveaverage air pressure over the eastern tropical Pacific.
To sum up:
El Niño refers to the oceanic component of the El Niño/Southern Oscillation
(ENSO) system
The Southern Oscillation refers to the atmospheric component
ENSO is the coupled ocean-atmosphere system
ENSO has 3 phases: a warm phase known as El Niño, a cold phase called La Niña
and neutral phase when neither El Niño or La Niña conditions occur.
Southern Oscillation Index
(SOI)
2. The normal mean sea level pressure (MSPL) at Tahiti
is higher than at Darwin. If the pressure at Darwin
rises relative to Tahiti the SOI becomes negative and
we have an El Niño event.
source: Climate System Lectures, Univ. of Columbia,
NY
The Southern Oscillation Index
(SOI) is a measure of the strength
and phase of the Southern
Oscillation. During El Niño episodes
the SOI has a large negative value
due to lower-than-average air
pressure at Tahiti and higher-thanaverage air pressure at Darwin.
During La Niña episodes, the SOI
has a positive value due to higherthan-average air pressure at Tahiti
and lower-than-average air
pressure at Darwin.
El Niño episodes occur in every 2-7
years.
ESPERE Climate Encyclopaedia – www.espere.net - Weather More - page 5
English offline version
supported by the International Max Planck Research School on Atmospheric Chemistry and Physics
3. The southern oscillation index SOI. Strong negative red values stand for El Niño events, strong
positive blue values stand for La Niña conditions.
Source: Long Paddock website, Gov. of Queensland
4. Sea Level Pressure 1960-1984
source: U. S. Army Topographic Engineering Center
Historical review on El Niño events
El Niño is not a new phenomenon, it has been around for thousands of
years. Chemical signatures of warmer sea surface temperatures and
increased rainfall caused by El Niño appear in coral specimens at least
4000 years old, but some researchers claim to have found coral records
that hold evidence of El Niño cycles more than a 100,000 years ago!
Records of El Niño events date back as
far as the 1500's. At that time
fisherman off the coast of Peru started
noticing that periodic warm waters
resulted in low anchovy catches.
However, Peruvian farmers also noted
that the warm waters lead to increased
rainfall, transforming normally barren
areas into fertile farmland.
Between 1700 and 1900 European
sailors made sporadic attempts at
documenting the phenomenon
and scientists became interested in
identifying the cause.
5. Fishermen off the coast of Peru. Warm waters
during El Niño events reduce the number of fish
along the Peruvian coast causing reduced fish
catches.
© downtheroad.org - Peru
It wasn't until the middle of the 20th century that the scientific causes of ENSO
were worked out. Interest increased in the late 1960's and early 1970's and,
ESPERE Climate Encyclopaedia – www.espere.net - Weather More - page 6
English offline version
supported by the International Max Planck Research School on Atmospheric Chemistry and Physics
using new observations including satellite data, climatologists and
oceanographers recognised that El Niño events were much more than just a local
feature of climate variability.
7. Atlas buoy
source: NOAA/PMEL
6. Nowadays we record conditions in the Pacific Ocean using fixed Atlas buoys which measure lots of
different parameters, both at the surface and at depth. We also use drifting buoys, research ships,
coastal tide gauge stations and make measurements of sea surface temperature from space
using satellites. All this data forms an El Niño early warning system which helps people prepare
for the next El Niño event.
© clivar.org
In 1923, a British Scientist, Sir Gilbert Walker discovered that when air pressure
is high in the Pacific, it is low in the Indian Ocean from Africa to Australia, and
vice versa. His findings, which he named the Southern Oscillation, were the first
indication that weather conditions in distant parts of the tropical Pacific region are
connected.
Fifty years later, in the late 1960's, Jacob Bjerknes a Norwegian meteorologist
and Professor of the University of California at Los Angeles came up with the first
detailed description of how El Niño works. He made the connection between
Walker’s Southern Oscillation and El Niño and this is now officially known as the El
Niño/Southern Oscillation or ENSO for short.
8. a) the Walker circulation over the Pacific.
The image shows the circulation for neutral
conditions.
© original: Bildungszentrum Markdorf
8. b) this is what changes during El Niño
conditions.
ESPERE Climate Encyclopaedia – www.espere.net - Weather More - page 7
English offline version
supported by the International Max Planck Research School on Atmospheric Chemistry and Physics
El Niño events and consequences
Between 1982 and 1983, a very strong
El Niño caused havoc around the
world. Associated floods, droughts &
wildfires killed about 2,000 people
worldwide. The damage caused
was estimated at US$13 billion.
9. Comparison of the absolute sea surface
temperature for normal conditions and the El
Niño event in 1982.
source: Climate science lecture, Univ. of
Columbia, NY
An even stronger El Niño event
developed in the Pacific between 1997
and 1998. Warnings were issued in mid
1997 and emergency preparedness
conferences were convened. By March
1998, El Niño-related events globally
caused US$34 billion of direct losses and
killed 24,000 people. 111 million people
were affected in some way and the
related events left 6 million displaced
people behind them.
Floods and fires are often a consequence of El Niño events. Smaller bush fires are
normal in shifting cultivation areas, such as Indonesia. But sometimes it is also
industrial burning, i.e. burning forest areas to enlarge plantations. Normally the
heavy rain in December extinguishes all fires. But under El Niño conditions there
is no rain.
Look at the following pictures what severe drought conditions mean.
10. Bush fires in Borneo, 1997 (Centre for Remote
Imaging, Sensing and Processing The National
University of Singapore.All images are acquired by
the SPOT satellites. Copyright of images CNES.)
11. Bush fires over Sumatra and Kalimantan,
Sept. 1997 (image: NOAA/NESDIS) author:
Bildungszentrum Marktdorf, Project group
ENSO
Source: http://www.enso.info/globaus.html
La Niña, on the other hand, can mean lots of rain in the following areas: South
Asia (during monsoon times), North and North East Australia, South Africa,
Northern South America, Central America, Hawaii.
ESPERE Climate Encyclopaedia – www.espere.net - Weather More - page 8
English offline version
supported by the International Max Planck Research School on Atmospheric Chemistry and Physics
Part 3: NAO
North Atlantic Oscillation (NAO)
Climate variability comprises three primary, but interrelated phenomena
in the North Atlantic region:
the Tropical Atlantic Variability
the North Atlantic Oscillation
the Atlantic Meridional Overturning Circulation.
The NAO is a fluctuation in a sea level pressure difference
between Iceland and the Azores. The name was first cited by
Gilbert Walker in 1924.
The history of the NAO
The NAO has a long history. The missionary Hans Egede Saabye made
observations in his diary as far back as 1770 to 1778: "When the winter in
Denmark was severe, as we perceive it, the winter in Greenland in its manner
was mild, and conversely". Simultaneously, coherent fluctuations in
temperatures, rainfall and sea level pressure were documented, reaching
eastwards to central Europe, southwards to subtropical West Africa and westward
to North America.
The fluctuations of NAO influence climate from North America to Siberia and from
the Arctic Ocean to the equator.
NAO index
The strength of the NAO is described by the NAO index. The NAO index is the
difference of sea-level pressure between two stations situated close to the centres
of the Icelandic Low and the Azores High. Stykkisholmur (Iceland) is used as the
northern station, and either Ponta Delgada (Azores), Lisbon (Portugal) or
Gibraltar are used as the southern station.
This simple index clearly does not take into account the possibility that the
centres of the actual pattern may not overlap with these locations, nor can it
accurately capture the seasonal variations in the NAO. However, there is a key
advantage to the use of such an index, existing weather records allow it to be
extended back in time to at least 1864. When the index is correlated or regressed
with gridded surface pressure data, the resulting north-south dipole pattern
defines the spatial pattern of the NAO.
ESPERE Climate Encyclopaedia – www.espere.net - Weather More - page 9
English offline version
supported by the International Max Planck Research School on Atmospheric Chemistry and Physics
The positive NAO index phase shows a
stronger than usual subtropical high
pressure center and a deeper than normal
Icelandic low. The increased pressure
difference results in more and stronger
winter storms crossing the Atlantic Ocean
on a more northerly track. This results in a
warm and wet winters in Europe and in
cold and dry winters in northern Canada
and Greenland. In this case, the eastern
US experiences mild and wet winter
conditions. For example, the high index
winter/springs of 1989, 1990, and 1995,
were caused by a net displacement of air
from over the Artic and Icelandic regions
towards the subtropic belt near the Azores
and the Iberian peninsula, and had
strengthened westerlies over the North
Atlantic Ocean. Stronger westerlies bring
more warm moist air over the European
continent and gives rise to milder maritime
winters.
1. source: http://www.ldeo.columbia.edu/
res/pi/NAO/
The negative NAO index phase shows a
weak subtropical high and a weak Icelandic
low. The reduced pressure gradient results
in fewer and weaker storms crossing on a
more west-east pathway. They bring moist
air into the Mediterranean and cold air
outbreaks and hence snowy weather
conditions. Greenland, however, has milder
winter temperatures. The low index
winter/springs of 1917, 1936, 1963, and
1969 had weaker mean westerlies over the
North Atlantic Ocean with corresponding
colder than normal European winters.
2. source: http://www.ldeo.columbia.edu/
res/pi/NAO/
Strengthened or weakened westerlies over the North Atlantic both have major
impacts on oceanic and some continental ecosystems. They have a large impact
on North Atlantic fish stocks.
ESPERE Climate Encyclopaedia – www.espere.net - Weather More - page 10
English offline version
supported by the International Max Planck Research School on Atmospheric Chemistry and Physics
3. source: http://www.ldeo.columbia.edu/res/pi/NAO/
The winter NAO index is defined as the anomalous difference between the polar
low and the subtropical high during the winter season (December through March).
NAO index has exhibited considerable variability over the past 100 years. From
the turn of the century until about 1930 (with exception of the 1916-1919
winters), the NAO was high and so stronger-than-usual winds carried the
moderating influence of the ocean over Europe contributing to the higher-thannormal European temperatures during this period. From early 1940's until the
early 1970's, the NAO index exhibited a downward trend corresponding to
a period when European wintertime temperatures were frequently lower than
normal. A sharp increase in the NAO has occurred over the past 25 years. Since
1980, the NAO has remained in a strongly positive phase and displayed an
upward trend. Since the turn of the 20th century, winters have exhibited the
most pronounced positive indices ever recorded (except 1996). This situation has
contributed much to the observed warming seen in northern hemisphere surface
temperatures over the past two decades.
ESPERE Climate Encyclopaedia – www.espere.net - Weather More - page 11
English offline version
supported by the International Max Planck Research School on Atmospheric Chemistry and Physics

