Human Population Pyramids Lab
advertisement
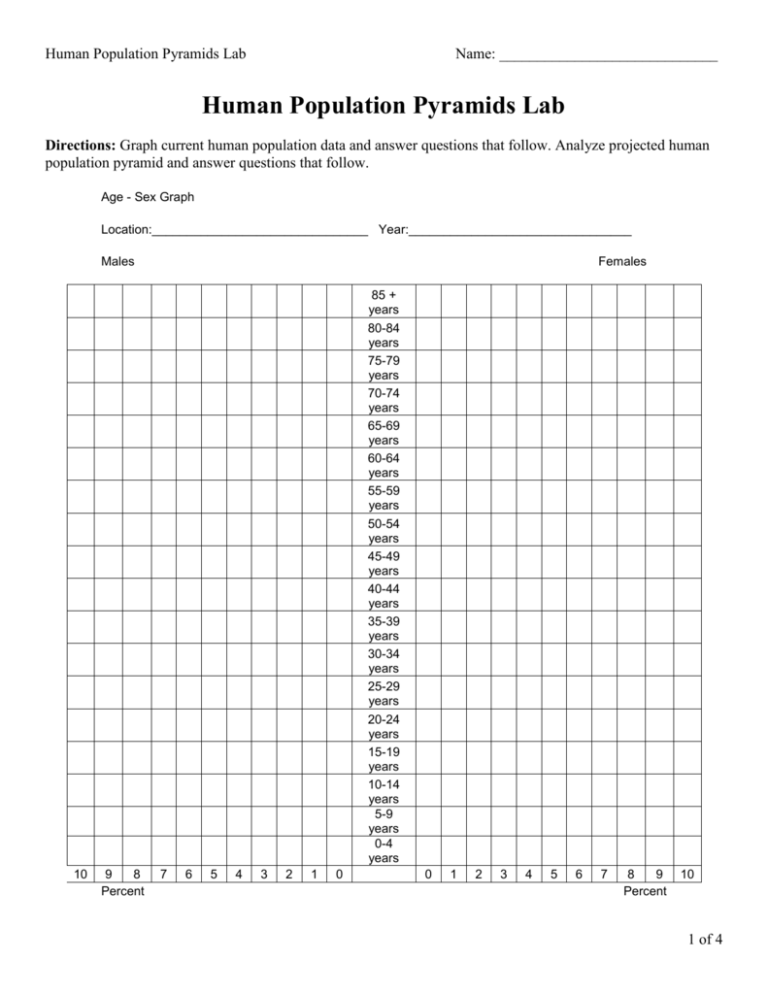
Human Population Pyramids Lab Name: _____________________________ Human Population Pyramids Lab Directions: Graph current human population data and answer questions that follow. Analyze projected human population pyramid and answer questions that follow. Age - Sex Graph Location:_______________________________ Year:________________________________ Males Females 85 + years 80-84 years 75-79 years 70-74 years 65-69 years 60-64 years 55-59 years 50-54 years 45-49 years 40-44 years 35-39 years 30-34 years 25-29 years 20-24 years 15-19 years 10-14 years 5-9 years 0-4 years 10 9 8 Percent 7 6 5 4 3 2 1 0 0 1 2 3 4 5 6 7 8 9 Percent 10 1 of 4 Human Population Pyramids Lab Name: _____________________________ U.S population data by age group Age Group Males (%) Females (%) 0-4 years 5-9 years 10-14 years 15-19 years 20-24 years 25-29 years 30-34 years 35-39 years 40-44 years 45-49 years 50-54 years 55-59 years 60-64 years 65-69 years 70-74 years 75-79 years 80-84 years 85 + years 7.3 6.5 7.9 7 7.9 7 7.6 6.7 7.2 6.5 7.2 6.6 7.6 7.1 8.5 8.1 8.4 8 7.4 7.1 6.3 6.2 4.8 4.8 3.8 4 3.3 3.6 0.3 3.5 2.2 3.1 1.4 2.2 0.9 2.1 Population Pyramid 2000 Questions: 1. What age group has the highest percentage of males in 2000? 2. What does the population pyramid tell us about the population in the United States in 2000? 3. Why does the profile of the graph change as the population is older? 4. Describe how the male and female population graphs are similar and different. 5. How would you describe the population growth of the country based on this graph? 2 of 4 Human Population Pyramids Lab Name: _____________________________ Projected Population Pyramid Summary for United States Source: U.S. Census Bureau, International Data Base. Projected Population Pyramid Questions: 1. What does the population pyramid tell us about the population in the U.S in the year 2050? 2. How does this graph compare to the graph you created first? 3. What are some negative and positive aspects of a population that has this graph? 4. Describe how the male and female population graph is similar and/or different from the 2000 graph (first graph). 5. What are the implications, suggested by the population pyramid, on government spending in 2025? 3 of 4 Human Population Pyramids Lab Name: _____________________________ 6. List 5 new facts that you have learned. 7. What BIG ideas stand out? 8. What does this mean for your generation? 4 of 4

