Image based modeling of nutrient movement in and around the
advertisement
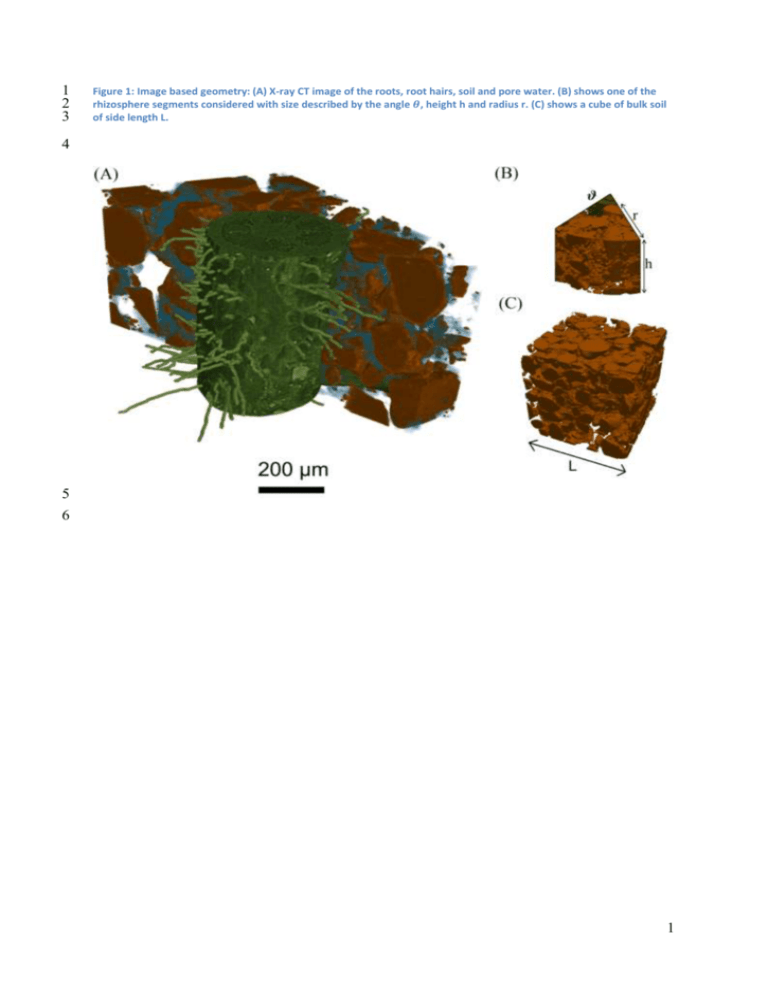
1 2 3 Figure 1: Image based geometry: (A) X-ray CT image of the roots, root hairs, soil and pore water. (B) shows one of the rhizosphere segments considered with size described by the angle 𝜽, height h and radius r. (C) shows a cube of bulk soil of side length L. 4 5 6 1 7 8 9 Figure 2: Schematic of the different regions used in the mathematical formulation of the problem. The bulk and rhizosphere regions are highlighted with the modelling domains 𝛀𝒓 , 𝚪𝟎𝒓 , 𝚪𝟎𝒉 , 𝚪𝒔𝒓 , 𝚪𝒂𝒓 and 𝚪𝒓𝒃 labeled for the rhizosphere and 𝛀𝒃 , 𝚪𝒔𝒃 and 𝚪𝒂𝒃 labeled for the bulk soil. 10 11 12 2 13 14 15 16 17 18 Figure 3: Schematic for root hair growth. The root hair geometry remains unchanged throughout the simulation. As the simulation progresses the active portion of the root hair grows. The streamlines show an estimation of the nutrient transport as affected by the presence of the root hair. At t=0 the root hair is non-active and acts only to geometrically impede the transport of nutrient. At t=1 day the root hair has grown to half its final length and acts partly to take up nutrients and partly as a geometrical impedance. Finally at t=2 days the root hair is fully grown. 19 3 20 21 22 23 Figure 4: Effective diffusion coefficient as a function of L , the side length of the cube. The results are plotted for the saturated case, S=1, corresponding to the pore space being completely full of water and partially saturated, S=0.33, corresponding to 1/3 of the pore space being occupied by water. As L is increased the saturated and unsaturated effective diffusion properties are seen to converge to a steady value corresponding to the bulk diffusion coefficient. 24 25 4 26 27 28 29 30 Figure 5: Typical plots obtained from simulation for, (1A) to (1E). the saturated case and, (2A) to (2E), the unsaturated case. The five images in each case correspond to 𝜽 = 𝟎. 𝟐 𝜽𝒎𝒂𝒙 = 𝝅/𝟓 and 𝒉 = 𝟎. 𝟐𝒉𝒎𝒂𝒙 = 𝟎. 𝟑𝟔 𝐦𝐦 for (A) 𝒓 = 𝟎. 𝟐𝒓𝒎𝒂𝒙 = 𝟎. 𝟑𝟓𝟐 𝐦𝐦, (B) 𝒓 = 𝟎. 𝟒𝒓𝒎𝒂𝒙 = 𝟎. 𝟕𝟎𝟒 𝐦𝐦, (C) 𝒓 = 𝟎. 𝟔𝒓𝒎𝒂𝒙 = 𝟏. 𝟎𝟓𝟔 𝐦𝐦, (D) 𝒓 = 𝟎. 𝟖𝒓𝒎𝒂𝒙 = 𝟏. 𝟒𝟎𝟖 𝐦𝐦 and (E) 𝒓 = 𝟏. 𝟎𝒓𝒎𝒂𝒙 = 𝟏. 𝟕𝟔 𝐦𝐦. The streamlines show the effective diffusion paths with red corresponding to high nutrient concentration and blue corresponding to lower nutrient concentration. 31 32 5 33 34 35 36 37 Figure 6: Log-linear plot of flux into (A) the root hairs in the saturated case, (B) the roots in the saturated case, (C) the root hairs in the unsaturated case and (D) the roots in the unsaturated case. The lines show the average flux over a period of one week for the five different radii considered up to a maximum of 𝒓𝒎𝒂𝒙 = 𝟏. 𝟕𝟔 𝐦𝐦. As r is increased the uptake profile is seen to converge. The figure insets show a zoomed in section of the same curve with error bars removed for clarity. 38 39 6 40 41 Figure 7: Total uptake into the root and root hair system averaged over all time points. Plot shows average uptake over the different radii considered with standard deviation error bars as a function of root surface area. 42 43 7 44 45 46 Figure 8: Root growth scenario for four different times: The top left shows the initial condition ( 0 hours), the top right shows the hair growth after 16 hours, the bottom left shows hair growth after 32 hours and the bottom right shows hair growth after 48 hours. 47 48 49 50 8 51 52 Figure 9: Flux at the root and hair surfaces for the root growth scenario in comparison to the fixed root hair scenario for the saturated and unsaturated geometries (logarithmic scale). The combined uptake of the root and hair is also plotted. 53 54 55 9
