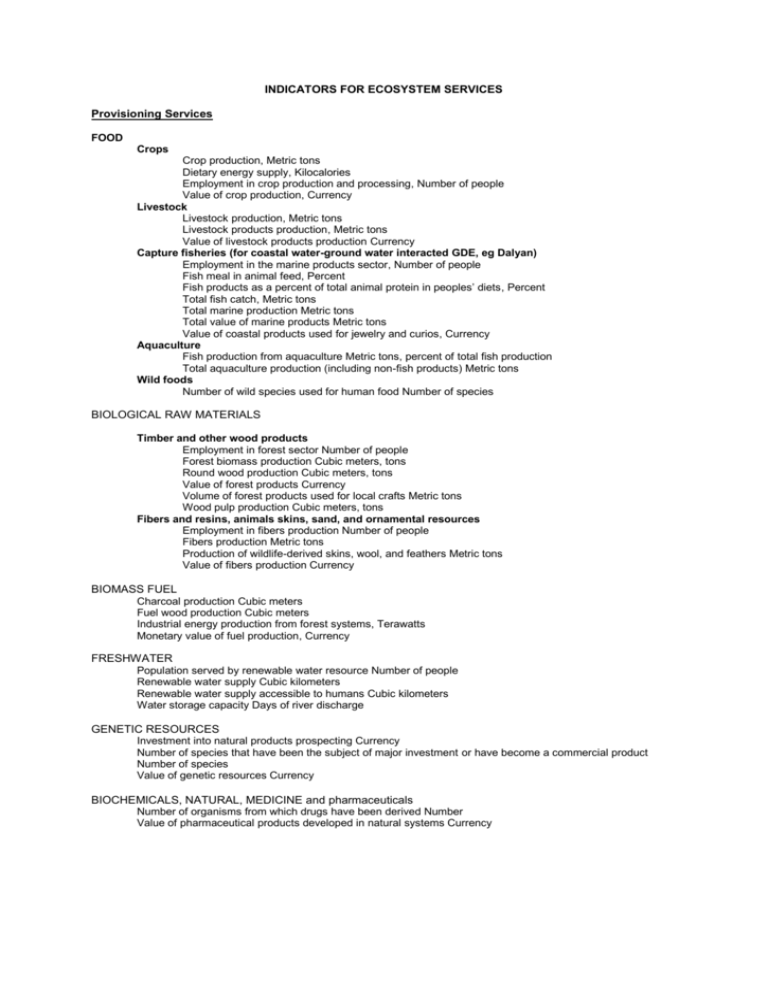
the list of ecosystem indicators
advertisement

INDICATORS FOR ECOSYSTEM SERVICES Provisioning Services FOOD Crops Crop production, Metric tons Dietary energy supply, Kilocalories Employment in crop production and processing, Number of people Value of crop production, Currency Livestock Livestock production, Metric tons Livestock products production, Metric tons Value of livestock products production Currency Capture fisheries (for coastal water-ground water interacted GDE, eg Dalyan) Employment in the marine products sector, Number of people Fish meal in animal feed, Percent Fish products as a percent of total animal protein in peoples’ diets, Percent Total fish catch, Metric tons Total marine production Metric tons Total value of marine products Metric tons Value of coastal products used for jewelry and curios, Currency Aquaculture Fish production from aquaculture Metric tons, percent of total fish production Total aquaculture production (including non-fish products) Metric tons Wild foods Number of wild species used for human food Number of species BIOLOGICAL RAW MATERIALS Timber and other wood products Employment in forest sector Number of people Forest biomass production Cubic meters, tons Round wood production Cubic meters, tons Value of forest products Currency Volume of forest products used for local crafts Metric tons Wood pulp production Cubic meters, tons Fibers and resins, animals skins, sand, and ornamental resources Employment in fibers production Number of people Fibers production Metric tons Production of wildlife-derived skins, wool, and feathers Metric tons Value of fibers production Currency BIOMASS FUEL Charcoal production Cubic meters Fuel wood production Cubic meters Industrial energy production from forest systems, Terawatts Monetary value of fuel production, Currency FRESHWATER Population served by renewable water resource Number of people Renewable water supply Cubic kilometers Renewable water supply accessible to humans Cubic kilometers Water storage capacity Days of river discharge GENETIC RESOURCES Investment into natural products prospecting Currency Number of species that have been the subject of major investment or have become a commercial product Number of species Value of genetic resources Currency BIOCHEMICALS, NATURAL, MEDICINE and pharmaceuticals Number of organisms from which drugs have been derived Number Value of pharmaceutical products developed in natural systems Currency Table 3 | Regulating Services Air quality regulation Flux in atmospheric gases Teragrams carbon, nitrogen per year, Atmospheric cleansing (tropospheric oxidizing) No units noted Global climate regulation Atmospheric gases flux (CO2, CH4, etc) Teragrams carbon, nitrogen per year, Carbon accumulation Teragrams, metric tons Carbon uptake Teragrams, metric tons Cloud formation No units noted Evapotranspiration Percent Carbon sequestration capacity Megagrams per hectare, metric tons Surface albedo Albedo Regional and local climate regulation Canopy stomatal conductance No units noted Cloud formation No units noted Evapotranspiration Cubic meters Water regulation Soil water infiltration No units noted Soil water storage No units noted Erosion regulation No Indicators Identified Water purification and waste treatment Amount of waste processed by ecosystems Volume/mass of waste processed Capacity of ecosystem to process waste Volume/mass of waste potentially processed Value of ecosystem waste treatment and water purification Currency Disease regulation Disease vector predator populations Number Estimated change in disease burden as a result of changing ecosystems, Number of disease cases Population increase in disease vectors mosquitoes following ecosystem conversion Mosquito population Soil quality regulation No Indicators Identified Pest regulation No Indicators Identified Pollination No Indicators Identified Natural hazard regulation Changes in seasonality of flood events Percentage change in number of events Economic losses associated with natural disasters Currency Flood attenuation potential: residence time of water in rivers, reservoirs, and soils Days required for water falling as precipitation to pass through system Floodplain water storage capacity Days of river discharge floodplain can store Soil capacity to transfer groundwater No units noted Soil water storage capacity No units noted Trends in number of damaging natural disasters Number of events Cultural services Aesthetic/ ethical values Comparative value of real estate near cleaner water bodies Yes/no, Currency Comparative value of real estate nearer to nature (proxy) Currency Number of nature/rural visitors Number of people Willingness to pay for improved water quality in local water bodies Currency Spiritual and religious values No Indicators Identified Recreation and ecotourism Nature and/or rural tourism employment Number of people Number of recreational anglers and hunters Number of people Spending on nature tourism Currency Total recreational value Currency Visitors to natural areas Currency


