Supplementary material A2: Börnhorst et al. Associations between
advertisement

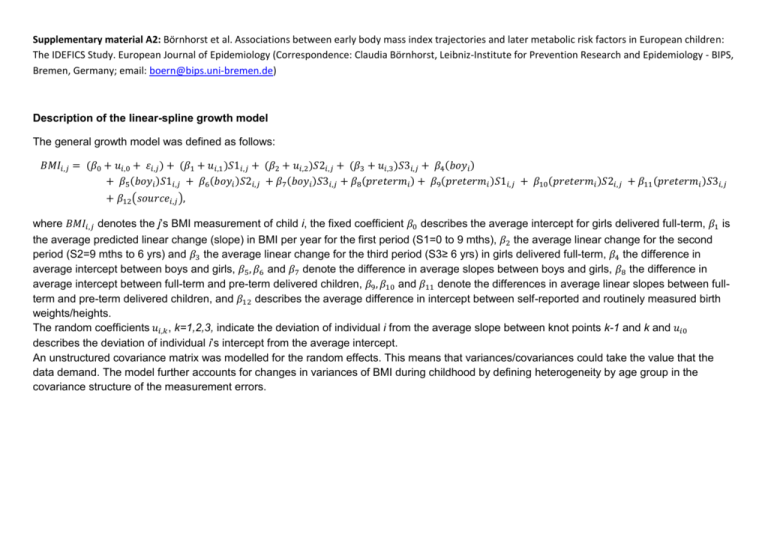
Supplementary material A2: Börnhorst et al. Associations between early body mass index trajectories and later metabolic risk factors in European children: The IDEFICS Study. European Journal of Epidemiology (Correspondence: Claudia Börnhorst, Leibniz-Institute for Prevention Research and Epidemiology - BIPS, Bremen, Germany; email: boern@bips.uni-bremen.de) Description of the linear-spline growth model The general growth model was defined as follows: 𝐵𝑀𝐼𝑖,𝑗 = (𝛽0 + 𝑢𝑖,0 + 𝜀𝑖,𝑗 ) + (𝛽1 + 𝑢𝑖,1 )𝑆1𝑖,𝑗 + (𝛽2 + 𝑢𝑖,2 )𝑆2𝑖,𝑗 + (𝛽3 + 𝑢𝑖,3 )𝑆3𝑖,𝑗 + 𝛽4 (𝑏𝑜𝑦𝑖 ) + 𝛽5 (𝑏𝑜𝑦𝑖 )𝑆1𝑖,𝑗 + 𝛽6 (𝑏𝑜𝑦𝑖 )𝑆2𝑖,𝑗 + 𝛽7 (𝑏𝑜𝑦𝑖 )𝑆3𝑖,𝑗 + 𝛽8 (𝑝𝑟𝑒𝑡𝑒𝑟𝑚𝑖 ) + 𝛽9 (𝑝𝑟𝑒𝑡𝑒𝑟𝑚𝑖 )𝑆1𝑖,𝑗 + 𝛽10 (𝑝𝑟𝑒𝑡𝑒𝑟𝑚𝑖 )𝑆2𝑖,𝑗 + 𝛽11 (𝑝𝑟𝑒𝑡𝑒𝑟𝑚𝑖 )𝑆3𝑖,𝑗 + 𝛽12 (𝑠𝑜𝑢𝑟𝑐𝑒𝑖,𝑗 ), where 𝐵𝑀𝐼𝑖,𝑗 denotes the j’s BMI measurement of child i, the fixed coefficient 𝛽0 describes the average intercept for girls delivered full-term, 𝛽1 is the average predicted linear change (slope) in BMI per year for the first period (S1=0 to 9 mths), 𝛽2 the average linear change for the second period (S2=9 mths to 6 yrs) and 𝛽3 the average linear change for the third period (S3≥ 6 yrs) in girls delivered full-term, 𝛽4 the difference in average intercept between boys and girls, 𝛽5 , 𝛽6 and 𝛽7 denote the difference in average slopes between boys and girls, 𝛽8 the difference in average intercept between full-term and pre-term delivered children, 𝛽9 , 𝛽10 and 𝛽11 denote the differences in average linear slopes between fullterm and pre-term delivered children, and 𝛽12 describes the average difference in intercept between self-reported and routinely measured birth weights/heights. The random coefficients 𝑢𝑖,𝑘 , k=1,2,3, indicate the deviation of individual i from the average slope between knot points k-1 and k and 𝑢𝑖0 describes the deviation of individual i’s intercept from the average intercept. An unstructured covariance matrix was modelled for the random effects. This means that variances/covariances could take the value that the data demand. The model further accounts for changes in variances of BMI during childhood by defining heterogeneity by age group in the covariance structure of the measurement errors.


