Experiment Six
advertisement
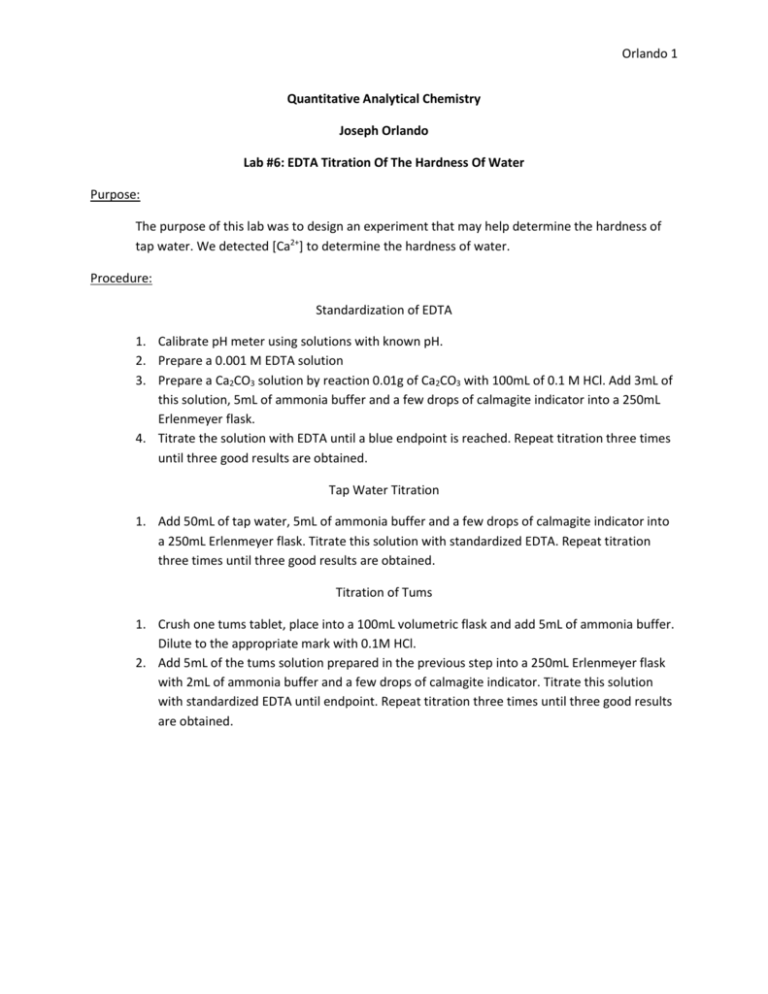
Orlando 1 Quantitative Analytical Chemistry Joseph Orlando Lab #6: EDTA Titration Of The Hardness Of Water Purpose: The purpose of this lab was to design an experiment that may help determine the hardness of tap water. We detected [Ca2+] to determine the hardness of water. Procedure: Standardization of EDTA 1. Calibrate pH meter using solutions with known pH. 2. Prepare a 0.001 M EDTA solution 3. Prepare a Ca2CO3 solution by reaction 0.01g of Ca2CO3 with 100mL of 0.1 M HCl. Add 3mL of this solution, 5mL of ammonia buffer and a few drops of calmagite indicator into a 250mL Erlenmeyer flask. 4. Titrate the solution with EDTA until a blue endpoint is reached. Repeat titration three times until three good results are obtained. Tap Water Titration 1. Add 50mL of tap water, 5mL of ammonia buffer and a few drops of calmagite indicator into a 250mL Erlenmeyer flask. Titrate this solution with standardized EDTA. Repeat titration three times until three good results are obtained. Titration of Tums 1. Crush one tums tablet, place into a 100mL volumetric flask and add 5mL of ammonia buffer. Dilute to the appropriate mark with 0.1M HCl. 2. Add 5mL of the tums solution prepared in the previous step into a 250mL Erlenmeyer flask with 2mL of ammonia buffer and a few drops of calmagite indicator. Titrate this solution with standardized EDTA until endpoint. Repeat titration three times until three good results are obtained. Orlando 2 Data: Standardization of EDTA Amount (mL) of EDTA titrated Molarity of EDTA Trial #1 9.55 0.0099 Trial #2 9.30 0.0102 Trial #3 9.50 0.0099 Average 9.45 0.100 Tap Water Titration Ca+ Concentration (M) ppm Trial #1 Amount(mL) of EDTA titrated 7.90 0.00158 63.323 Trial #2 6.90 0.00138 55.307 Trial #3 6.00 0.00120 48.094 Average 6.93 0.00139 55.575 TUMS Titration Amount(mL) of EDTA Titrated Ca2+ in Sample (%) Trial #1 0 0 Trial #2 16.20 0.42% Trial #3 14.20 0.37% Average 15.20 0.395% Standard Deviation ±0.035 Relative Standard Deviation 8.86% Orlando 3 Equations: Mass EDTA Needed 0.01 mol EDTA 372.24 g EDTA × 0.500 L × = 0.7306 g EDTA 1L mol M EDTA 0.3161 g CaCO3 × 1 𝑚𝑜𝑙 𝐶𝑎𝐶𝑂3 1 0.003 𝐿 1 × × × = 0.0099 𝑀 100.09 𝑔 𝐶𝑎𝐶𝑂3 0.100 𝐿 𝑠𝑜𝑙𝑢𝑡𝑖𝑜𝑛 1 . 00955 𝐿 𝐸𝐷𝑇𝐴 Ca+ Concentration in Tap Water 0.0100 M EDTA × 0.0079 𝐿 𝐸𝐷𝑇𝐴 𝑎𝑑𝑑𝑒𝑑 1 𝑚𝑜𝑙 𝐶𝑎 + 1 × × = 0.00158𝑀 𝐶𝑎 + 1 1 𝑚𝑜𝑙 𝐸𝐷𝑇𝐴 0.05 𝐿 Hardness of Water 0.00158 𝑀 𝐶𝑎 + × 40.078 𝑔 𝐶𝑎 + 1 𝑚𝑔 × = 211.61 𝑝𝑝𝑚 1 𝑚𝑜𝑙 𝐶𝑎 + 0.001 𝑔 Claimed Amount of Ca2+ in Tablet 0.3161 𝑔 𝐶𝑎𝐶𝑂3 × 1 𝑚𝑜𝑙 𝐶𝑎𝐶𝑂3 1 𝑚𝑜𝑙 𝐶𝑎 2 + 40.078 𝑔 𝐶𝑎 2 + × × = 0.1266 𝑔 𝐶𝑎 2 + 100.09 𝑔 𝐶𝑎𝐶𝑂3 1 𝑚𝑜𝑙 𝐶𝑎𝐶𝑂3 1 𝑚𝑜𝑙 0.1266 𝑔 𝐶𝑎 2 + × 100% = 8.14% 1.5561 𝑔 𝑡𝑎𝑏𝑙𝑒𝑡 Amount Ca2+ in Sample 0.0100 𝑀 𝐸𝐷𝑇𝐴 × 0.0162 𝐿 𝐸𝐷𝑇𝐴 1 𝑚𝑜𝑙 𝐶𝑎 2 + 40.078 𝑔 𝐶𝑎 2 + × × = 0.0065 𝑔 1 1 𝑚𝑜𝑙 𝐸𝐷𝑇𝐴 1 𝑚𝑜𝑙 𝐶𝑎 2 + % Ca2+ in Sample 0.0065 𝑔 𝐶𝑎 2 + × 100% = 0.42% 1.5561 𝑔 𝑡𝑎𝑏𝑙𝑒𝑡 Orlando 4 Conclusion: The purpose of this experiment was to devise an experimental procedure that would allow us to accurately determine the hardness of tap water. Hard water is defined as water that contains many positively charged ions (cations). The procedure that I improvised measured the concentration of Ca2+ in the tap water to measure hardness. A standard titrant, EDTA, was first prepared to titrate against several samples of tap water. EDTA or Ethlenediaminetetraacetic acid is a chelating agent that sequesters free metal ions (such as Ca2+). It was experimentally determined that the average hardness of the tap water was 55.575 ppm. According to the United States Geological Survey Water-Quality Information this tap water is considered to be soft. TUMS was titrated to test the validity of the EDTA being used. The claimed amount of Ca2+ in a TUMS tablet is 8.14% whereas the experimentally determined value was 0.24%, a difference of 8.11%. This leads me to believe that there was human error in the experiment somewhere that lead to this large difference.
