gcb12034-sup-0002-AppendixS1
advertisement

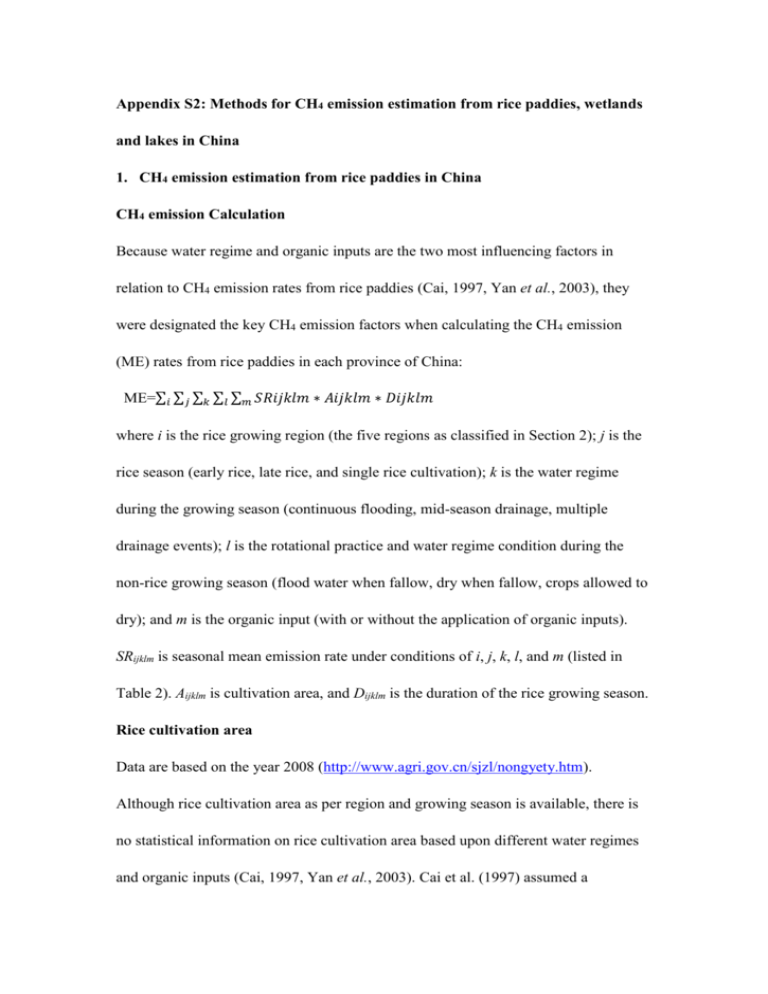
Appendix S2: Methods for CH4 emission estimation from rice paddies, wetlands and lakes in China 1. CH4 emission estimation from rice paddies in China CH4 emission Calculation Because water regime and organic inputs are the two most influencing factors in relation to CH4 emission rates from rice paddies (Cai, 1997, Yan et al., 2003), they were designated the key CH4 emission factors when calculating the CH4 emission (ME) rates from rice paddies in each province of China: ME=∑𝑖 ∑𝑗 ∑𝑘 ∑𝑙 ∑𝑚 𝑆𝑅𝑖𝑗𝑘𝑙𝑚 ∗ 𝐴𝑖𝑗𝑘𝑙𝑚 ∗ 𝐷𝑖𝑗𝑘𝑙𝑚 where i is the rice growing region (the five regions as classified in Section 2); j is the rice season (early rice, late rice, and single rice cultivation); k is the water regime during the growing season (continuous flooding, mid-season drainage, multiple drainage events); l is the rotational practice and water regime condition during the non-rice growing season (flood water when fallow, dry when fallow, crops allowed to dry); and m is the organic input (with or without the application of organic inputs). SRijklm is seasonal mean emission rate under conditions of i, j, k, l, and m (listed in Table 2). Aijklm is cultivation area, and Dijklm is the duration of the rice growing season. Rice cultivation area Data are based on the year 2008 (http://www.agri.gov.cn/sjzl/nongyety.htm). Although rice cultivation area as per region and growing season is available, there is no statistical information on rice cultivation area based upon different water regimes and organic inputs (Cai, 1997, Yan et al., 2003). Cai et al. (1997) assumed a minimum of 57.7% of all rice paddies undergo mid-season drainage. Yan et al. (2003) further assumed that one-third of all irrigated rice paddies undergo conditions of continuous flooding while the remainder undergo intermittent irrigation. Because several drainage methods are used in rice paddies that are easily drained, a number of water regime drainage scenarios were added in this study to counteract the drainage methods used. This study assumes that 30% of all rice paddies undergo continuous flooding, another 30% undergo mid-season drainage events, and 40% undergo multiple drainage events. For winter crop rotation and managerial practices based on data acquired from Hunan Province (Cai et al., 2001), it was assumed by this study that in winter 8% of all rice paddies undergo fallow periods and are then flooded during the winter, 17% undergo dry fallow periods, and 75% are planted with crops in AEZ 6A and 7. For AEZ 6B, the majority of rice paddies are allowed to fallow and are then flooded during the winter: 59% for Chongqing (Wei et al., 2000), 18.5% for Sichuan (Liu & Zhu, 2007), 35% for Guizhou, and 15% for Yunnan. Moreover, it was also assumed that during winter only 10% of all rice paddies undergo dry fallow periods in AEZ 6B. Percentages of rice paddies planted with crops are 21% for Chongqing, 71.5% for Sichuan, 55% for Guizhou, and 75% for Yunan. In AEZ 5 and 8A, almost all rice paddies undergo dry fallow periods during the winter (100% dry fallow). It was also assumed that half of all rice paddies received substantial organic inputs in accordance to findings from Yan et al. (2003). Duration of rice growing seasons The duration of rice growth varied per region and per season, and it directly influenced total seasonal CH4 emission rates (Yan et al., 2003). The average duration of a rice growth period for the single rice in the cold AEZ 5 and 8 regions is approximately 127 days, based upon published data, while the growth period for the single, early, late rice in the warm AEZ 6 and 7 regions is 115, 90, 80 days, respectively. 2. CH4 emission estimation from natural wetlands in China CH4 emission calculation Due to the considerable effects that wetland types and water regimes have on CH4 emission rates in relation to natural wetland systems, wetland types and water regimes were established as the two primary CH4 emission factors when calculating CH4 emission (ME) rates from natural wetlands in each province in China: ME= ∑𝑖 ∑𝑗 ∑𝑘 𝑆𝑅𝑖𝑗𝑘 ∗ 𝐴𝑖𝑗𝑘 ∗ 𝐷𝑖𝑗𝑘 Where i is the wetland type (all four types are classified in Section 3); j is the growing season and the non-growing season (between the different regions); and k is the water regime during the growing season (for continuous and seasonally flooding). SRijk is the seasonal mean CH4 emission rate under conditions of i, j, and k (listed in Table 2) while Aijk is the cultivation area and Dijk is the duration of the growing or non-growing season. Wetland area The area data of this study is based upon previous studies in China wherein wetland area for each region and each wetland type is available (Ding et al., 2004, Zhao, 1999). However, no statistical data in relation to wetland area exists concerning the different water regimes. This study assumed that only 30% of all wetlands in each type are continuously flooded due to the considerable degradation of natural wetlands in China (An et al., 2007). The remaining wetlands are seasonally flooded. Duration of the growing and non-growing season The duration of wetland plant growth is generally longer in southern and eastern China due to a warmer climate and higher precipitation rate while the growing season is much shorter in western and northern China due to its colder and drier conditions. In concurrence with Ding et al. (2004b), this study assumed that in south and southeastern China the duration of wetland plant growth is approximately 300 days while in west and northern China the duration is only 165 days (5.5 months). Subsequently, the non-growing season duration is approximately 60 days for the south and southeastern regions and 200 days for the west and northern regions. 3. CH4 emission estimates from lakes and reservoirs in China CH4 emissioncalculation The following quotation was used to calculate the CH4 emission (ME) rate from lakes and reservoirs in each province of China: ME=∑𝑖 ∑𝑗 ∑𝑘 𝑆𝑅𝑖𝑗𝑘 ∗ 𝐴𝑖𝑗𝑘 ∗ 𝐷𝑖𝑗𝑘 Where i is the lake region (the five types are classified in Section 4); j is the growing season and non-growing season (between the different regions); and k is the different zones (pelagic zone and/or littoral zone). SRijk is the seasonal mean emission rate under conditions of i, j, and k (listed in Table 2). Aijk is the cultivation area, and Dijk is the duration of the growing and non-growing season or the unfrozen season. Lake and reservoir area Data from this study are based on the first wetland investigation in China (Year book of China, 2009) wherearea data for lakes, ponds, and reservoirs are available per province. However, no data exists concerning littoral zones. The cover rate of littoral zones was assumed at 5% to 12% for all lakes in China based on a preliminary estimate (Chen et al., 2009). Total littoral area of natural lake systems, therefore, is approximately 10,021 km2 and total littoral area of reservoirs and ponds is approximately 2,742 km2in China. Duration of seasons In the southern and southeastern regions of China where warmer conditions and higher precipitation persist, the duration of the wetland season is generally longer while in the western and northern regions, due to colder and drier conditions, the growing season is much shorter. This study assumed that in the Qinghai-Tibetan Plateau, the northeast, and the Mongolia-Xinjiang Plateau regions, the growing season is approximately 165 days, and the unfrozen season of the lake surface is similar to the growing season in terms of duration. In the north of the plains of eastern China, the growing season is also brief at 165 days, but the unfrozen season of the lake surface is longer (approximately 300 days). In the south of the plains of eastern China, the growing season is longer at 300 days, and the lake remains unfrozen the entire year. In the southwest of the plains of eastern China, the growing season is approximately 200 days and the lake also remains unfrozen throughout the year. In the Yunan-Guizhou Plateau region, the growing season is approximately 200 days, and the lake again remains unfrozen throughout the year. References An S, Li H, Guan B et al. (2007) China’s natural wetlands: past problems, current status, and future challenges. Ambio,36, 335-342. Cai Z C (1997) A category for estimate of CH4 emission from rice paddy fields in China.Nutrient Cycling in Agroecosystems,49, 171-179. Cai Z C, Haruotsuruta, Rong X, Xu H, Yuan Z (2001) CH 4 emissions from rice paddies managed according to farmer’s practice in Hunan, China. Biogeochemistry,56, 75-91. Chen H, Wu N, Yao S P et al. (2009) High methane emissions from a littoral zone on the Qinghai-Tibetan Plateau.Atmospheric Environment,43, 4995-5000 Ding W X, Cai Z, Wang D (2004) Preliminary budget of methane emissions from natural wetlands in China. Atmospheric Environment,38, 751-759. Liu D, Zhu X (2007) Management and utilization of winter-flooded rice paddies in Sichuan province. Sichuan Agricultural Science and Techenology, 5-6, in Chinese. Wei C F, Gao M, Huang Q et al. (2000) Effects of tillage-cropping systems on methane emissions from year-round flooded paddy field in Southwest China. Acta Pedologica Sinica,37, 157-165, in Chinese with an English abstract. Yan X, Cai Z, Ohara T, Akimoto H (2003) Methane emission from rice fields in mainland China: Amount and seasonal and spatial distribution. Journal of Geophysical Research,108, 4505, doi:10.1029/2002JD003182. Zhao K Y (1999) Mires in China, Beijing,China, Science Press.


