Example rubric
advertisement
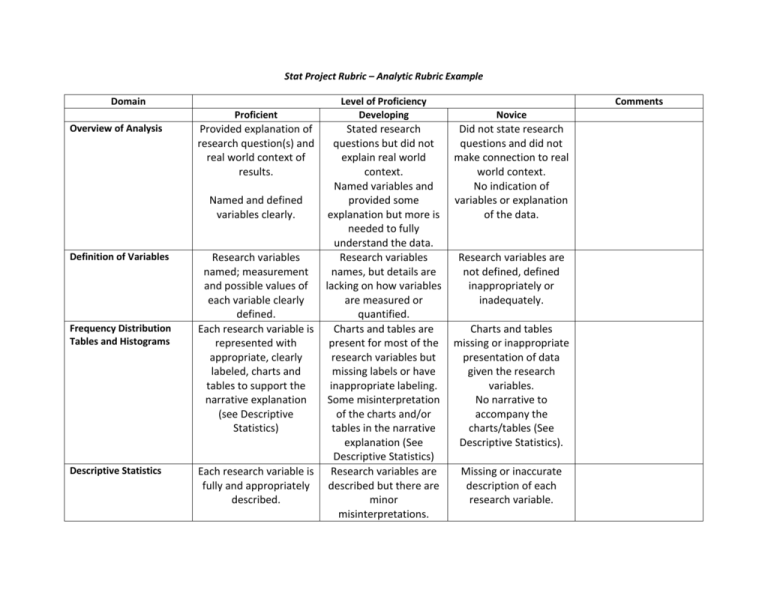
Stat Project Rubric – Analytic Rubric Example Domain Proficient Overview of Analysis Provided explanation of research question(s) and real world context of results. Named and defined variables clearly. Definition of Variables Frequency Distribution Tables and Histograms Descriptive Statistics Research variables named; measurement and possible values of each variable clearly defined. Each research variable is represented with appropriate, clearly labeled, charts and tables to support the narrative explanation (see Descriptive Statistics) Each research variable is fully and appropriately described. Level of Proficiency Developing Stated research questions but did not explain real world context. Named variables and provided some explanation but more is needed to fully understand the data. Research variables names, but details are lacking on how variables are measured or quantified. Charts and tables are present for most of the research variables but missing labels or have inappropriate labeling. Some misinterpretation of the charts and/or tables in the narrative explanation (See Descriptive Statistics) Research variables are described but there are minor misinterpretations. Comments Novice Did not state research questions and did not make connection to real world context. No indication of variables or explanation of the data. Research variables are not defined, defined inappropriately or inadequately. Charts and tables missing or inappropriate presentation of data given the research variables. No narrative to accompany the charts/tables (See Descriptive Statistics). Missing or inaccurate description of each research variable. Pearson’s Correlation Coefficient Scatter Plot Linear Regression Confidence Intervals The correlation coefficient and its interpretation (e.g., not causation) are correctly reported, Scatter plot is present and correct; wellillustrated, scaled, and readable, axes are labeled, and there is a discussion of connections to the correlation coefficient, r Regression line and equation are both correct; slope is reported and interpreted accurately; R2 is reported and interpreted accurately. A prediction example relevant to the identified context is used to demonstrate the regression equation. The correlation coefficient is reported but it is misinterpreted (e.g., linked to causation, Scatter plot is present and correct but there are issues with the illustration, scalability, and/or labeling. There is not a discussion of the connection to the correlation coefficient, r Regression line is present and correct; regression equation is reported and is correct; slope is reported correctly and the interpretation is partially correct. R2 is reported correctly and interpretation is partially correct. Confidence interval presented with correct interpretation to Confidence interval presented but missing interpretation or Correlation coefficient is not reported or incorrect; incorrect or inadequate explanation of the Scatter plot missing, or incorrect (e.g., confusion between predictor and criterion variables). No connection to the correlation coefficient, r Regression line is missing, incorrect, or poorly illustrated; equation of regression line not reported and inadequately explained or not explained at all. Slope of regression line is not reported correctly and/or the interpretation of the slope is incorrect. R2 is completely missing from Discussion. Missing confidence interval or explanation missing or inappropriate context Testing of Means Hypothesis Testing Procedure Discussion inappropriate is provided. interpretation provided. Appropriate t-test Appropriate t-test Inappropriate t-test implemented to address implemented to address implemented and/or no stated hypotheses; stated hypotheses; consideration of consideration of incomplete statistical assumptions. statistical assumptions consideration of provided. statistical assumptions provided. Null and alternative Null and/or alternative Hypotheses are missing hypotheses are clearly hypotheses are stated or are inappropriately and correctly stated with some inappropriate stated (incorrect using appropriate use of statistical symbols). statistical symbols. symbols. Incorrect statistical An appropriate An appropriate procedure is statistical test is statistical test is implemented to address implemented correctly. implemented but the hypotheses. Correct conclusions are conclusions drawn Incorrect conclusions drawn based upon the based upon obtained are drawn based upon obtained critical value. critical value are the obtained critical Interpretation of the incorrect. value or conclusions are conclusion relative to Misinterpretation of the completely missing. the hypotheses in conclusions and/or Misinterpretation of the clearly stated and lacking contextualization conclusion relative to accurate within the and connection back to the hypotheses with no given context. No the hypotheses. contextualization or unwarranted connection of the stated conclusions. hypotheses. Discussion of results is Adequate discussion of Implications of results insightful; adds meaning results but limited not discussed; no and significance to the reflection into why the attempt to explain Presentation findings. results occurred. findings. Report draws unwarranted conclusions or uses inappropriately certain language (e.g., “we proved”). The document is written with logic, clarity, and precision using scholarly language. The text is logical and coherent. There is consistent application of the scholarly writing and publication guidelines. The document tends to be logically organized but there is a lack of precision and clarity. The use of scholarly language is sporadic throughout the document. Inconsistent or inappropriate application of scholarly writing and publication guidelines. The document is not written in a scholarly fashion or lacks precision and clarity. Failure to follow scholarly writing and publication guidelines.
