predator/prey interactions
advertisement
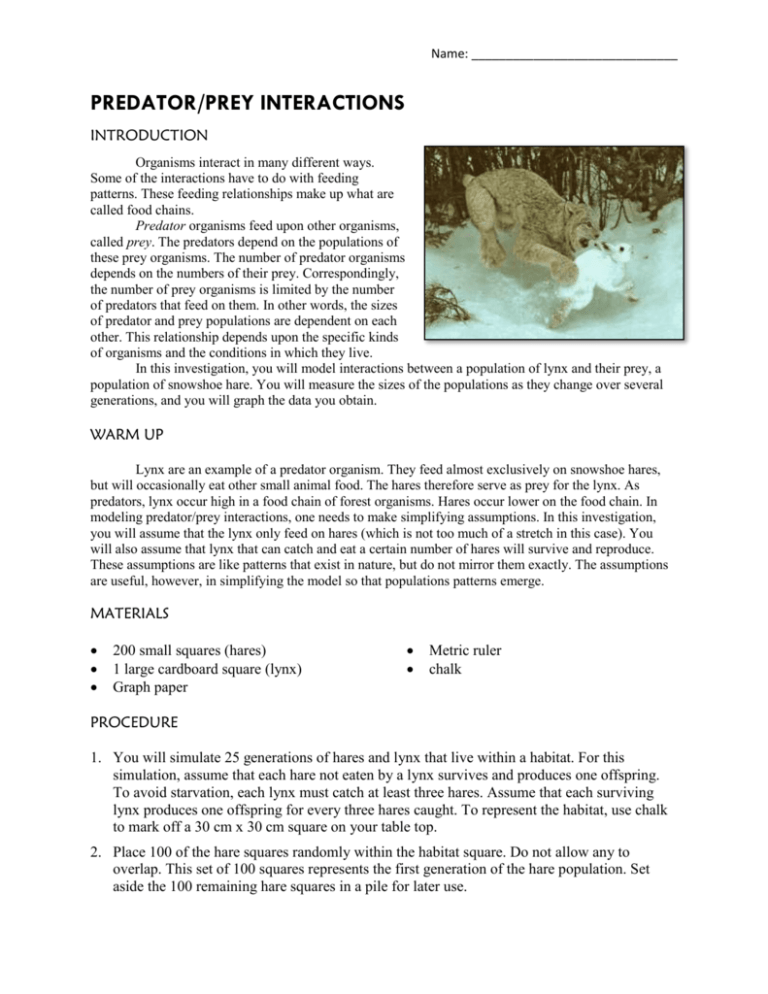
Name: ______________________________ PREDATOR/PREY INTERACTIONS INTRODUCTION Organisms interact in many different ways. Some of the interactions have to do with feeding patterns. These feeding relationships make up what are called food chains. Predator organisms feed upon other organisms, called prey. The predators depend on the populations of these prey organisms. The number of predator organisms depends on the numbers of their prey. Correspondingly, the number of prey organisms is limited by the number of predators that feed on them. In other words, the sizes of predator and prey populations are dependent on each other. This relationship depends upon the specific kinds of organisms and the conditions in which they live. In this investigation, you will model interactions between a population of lynx and their prey, a population of snowshoe hare. You will measure the sizes of the populations as they change over several generations, and you will graph the data you obtain. WARM UP Lynx are an example of a predator organism. They feed almost exclusively on snowshoe hares, but will occasionally eat other small animal food. The hares therefore serve as prey for the lynx. As predators, lynx occur high in a food chain of forest organisms. Hares occur lower on the food chain. In modeling predator/prey interactions, one needs to make simplifying assumptions. In this investigation, you will assume that the lynx only feed on hares (which is not too much of a stretch in this case). You will also assume that lynx that can catch and eat a certain number of hares will survive and reproduce. These assumptions are like patterns that exist in nature, but do not mirror them exactly. The assumptions are useful, however, in simplifying the model so that populations patterns emerge. MATERIALS 200 small squares (hares) 1 large cardboard square (lynx) Graph paper Metric ruler chalk PROCEDURE 1. You will simulate 25 generations of hares and lynx that live within a habitat. For this simulation, assume that each hare not eaten by a lynx survives and produces one offspring. To avoid starvation, each lynx must catch at least three hares. Assume that each surviving lynx produces one offspring for every three hares caught. To represent the habitat, use chalk to mark off a 30 cm x 30 cm square on your table top. 2. Place 100 of the hare squares randomly within the habitat square. Do not allow any to overlap. This set of 100 squares represents the first generation of the hare population. Set aside the 100 remaining hare squares in a pile for later use. Page 2 3. Hold the lynx square at a height of about 30 cm above the habitat square, and drop it onto the habitat. Assume that any hare square that is at least partially covered by the lynx square is a catch. Catch as many of the hares as you can with one drop. Remove and count the captured hares. Assume that there are two lynx in the first generation, and drop the hare square a second time to represent the feeding attempt of this second lynx. Again, remove and count any hares that have been caught. 4. In column D of the table in the Observations section, record the total number of hares caught by both lynx. Note that columns B and C have already been filled in with the original numbers of hares and lynx in the first generation. 5. Each hare that has not been caught is assumed to produce offspring. Add to the habitat one offspring for each hare that has not been caught. Use the pile of hare squares that you reserved earlier as offspring. In column F, record the total number of surviving hares and offspring. 6. Determine whether each of the lynx survives and reproduces. (Remember that a lynx must catch at least three hares to survive, and that it produces one offspring for every three hares it has caught.) Note and record in column E of the Observation section the number of lynx that have starved. Record in column G the total number of surviving lynx and their offspring. This number will equal the number of drops to be made by lynx in the next generation. 7. Copy the numbers from columns F and G of generation 1 to columns B and C respectively, of generation 2. These numbers represent the population sizes of hares and lynx present at the start of the second generation. 8. Repeat steps 3 through 7 until you have simulated 25 generations. Stop after the lynx from the 24th generations feed. Make certain that at the beginning of each generation there are at least three hares and one lynx in the habitat. If the populations fall too low, bring the numbers up to these minimum values by adding hare squares or allowing one lynx drop. Also note that the hare population cannot exceed 200. This is the carrying capacity of the environment for hares. 9. On a sheet of graph paper, use your data to make a graph of the numbers of hares and lynx at the beginning of each generation versus the generation number. Plot the generation number along the x-axis. Plot the numbers of hares and lynx along the y-axis. Use dots to mark the numbers of hares and Xs to mark the numbers of lynx. Connect the dots to for a curve for hares. Connect the Xs to for a curve for lynx. 10. When you have finished your graph, discuss the answers to the Data Analysis and Conclusion questions with your group members. Select someone in the group to serve as the recorder. The recorder should write the group’s answers on a separate sheet of paper and submit these along with the graph that you made in step 9 as evidence of completion of this laboratory investigation. Page 3 OBSERVATIONS Table 1. Snowshoe Hare and Lynx Populations A Generation 1 2 3 4 5 6 7 8 9 10 11 12 13 14 15 16 17 18 19 20 21 22 23 24 25 B Number of hares at start of generation 100 C Number of lynx at start of generation 2 D E Number of hares caught Number of lynx starved F Number of surviving hares and offspring G Number of surviving lynx and offspring Page 4 DATA ANALYSIS & CONCLUSION Answer the following in complete sentences on a separate sheet of paper. 1. What happened to the hare population during the first few generations? What happened to the lynx population during this period? 2. What happened to the hare population after many more generations? What happened to the lynx population? 3. Based on your graph, relate the trends in the population sizes of the hares and the lynx. 4. Suppose you were given an unlabeled graph of lynx and hare populations. Given what you observed on the graph you made, how could you infer which curve represented the lynx and which represented the hares? 5. Compare your model of interactions with Figure 8-7 on page 166 of your textbook. How are they similar? How are they different? 6. What would happen if a second animal species that fed on snowshoe hares, such as a wolf, were added to the simulation you carried out? Design an experiment to test your prediction. Remember to make simplifying assumptions before carrying out the simulation. Explain your experiment, simplifying assumptions, and results. REFERENCES Bernstein, Leonard. "Investigation 8." Addison-Wesley Environmental Science: Ecology and Human Impact : Laboratory Manual. Menlo Park, CA: Addison-Wesley, 1996. 37-40. Print. Miller, G. Tyler, and Scott Spoolman. "Figure 8-7." Living in the Environment: Principles, Connections, and Solutions. Belmont, CA: Thomson Brooks/Cole, 2007. 166. Print. Walch, Robert. Lynx and Snowshoe Hare. 1972. Photograph. The American North Woods/The Worlds Wild Places. Time Life Series. Sci-Fi-O-Rama. 31 Mar. 2008. Web. 28 Nov. 2011. <http://www.sci-fi-o-rama.com/2008/03/31/lynx-and-snowshoe-hare-2/>.
