Supporting Information ITS1 copy number varies among
advertisement
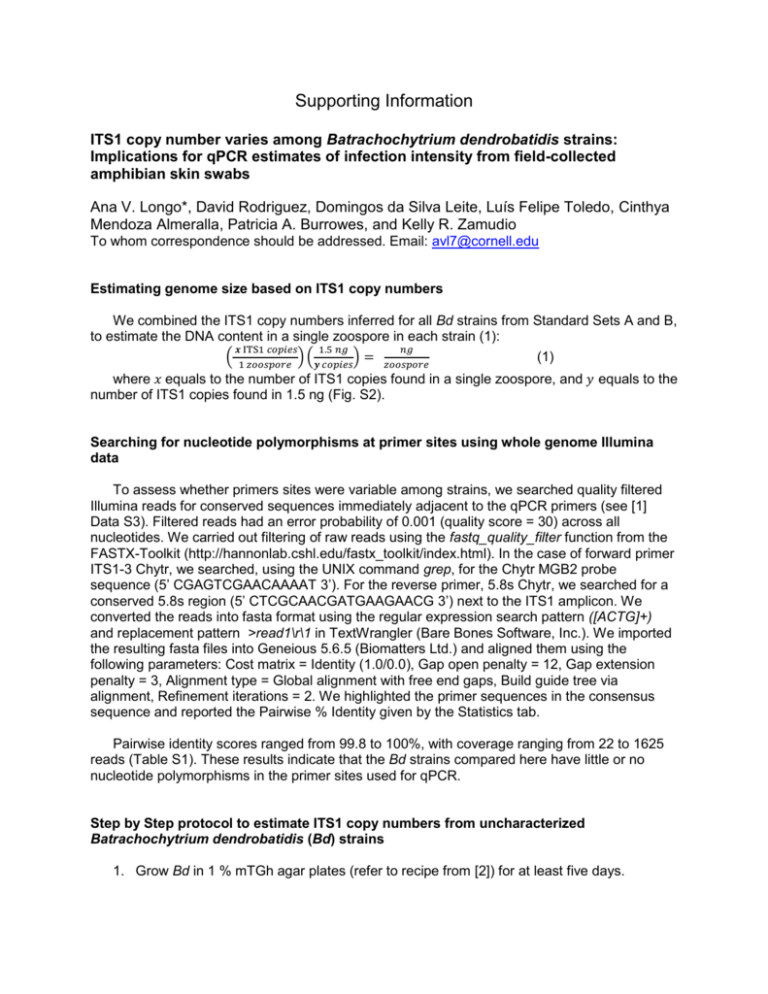
Supporting Information ITS1 copy number varies among Batrachochytrium dendrobatidis strains: Implications for qPCR estimates of infection intensity from field-collected amphibian skin swabs Ana V. Longo*, David Rodriguez, Domingos da Silva Leite, Luís Felipe Toledo, Cinthya Mendoza Almeralla, Patricia A. Burrowes, and Kelly R. Zamudio To whom correspondence should be addressed. Email: avl7@cornell.edu Estimating genome size based on ITS1 copy numbers We combined the ITS1 copy numbers inferred for all Bd strains from Standard Sets A and B, to estimate the DNA content in a single zoospore in each strain (1): 𝒙 ITS1 𝑐𝑜𝑝𝑖𝑒𝑠 1.5 𝑛𝑔 𝑛𝑔 ( 1 𝑧𝑜𝑜𝑠𝑝𝑜𝑟𝑒 ) (𝒚 𝑐𝑜𝑝𝑖𝑒𝑠) = 𝑧𝑜𝑜𝑠𝑝𝑜𝑟𝑒 (1) where 𝑥 equals to the number of ITS1 copies found in a single zoospore, and 𝑦 equals to the number of ITS1 copies found in 1.5 ng (Fig. S2). Searching for nucleotide polymorphisms at primer sites using whole genome Illumina data To assess whether primers sites were variable among strains, we searched quality filtered Illumina reads for conserved sequences immediately adjacent to the qPCR primers (see [1] Data S3). Filtered reads had an error probability of 0.001 (quality score = 30) across all nucleotides. We carried out filtering of raw reads using the fastq_quality_filter function from the FASTX-Toolkit (http://hannonlab.cshl.edu/fastx_toolkit/index.html). In the case of forward primer ITS1-3 Chytr, we searched, using the UNIX command grep, for the Chytr MGB2 probe sequence (5’ CGAGTCGAACAAAAT 3’). For the reverse primer, 5.8s Chytr, we searched for a conserved 5.8s region (5’ CTCGCAACGATGAAGAACG 3’) next to the ITS1 amplicon. We converted the reads into fasta format using the regular expression search pattern ([ACTG]+) and replacement pattern >read1\r\1 in TextWrangler (Bare Bones Software, Inc.). We imported the resulting fasta files into Geneious 5.6.5 (Biomatters Ltd.) and aligned them using the following parameters: Cost matrix = Identity (1.0/0.0), Gap open penalty = 12, Gap extension penalty = 3, Alignment type = Global alignment with free end gaps, Build guide tree via alignment, Refinement iterations = 2. We highlighted the primer sequences in the consensus sequence and reported the Pairwise % Identity given by the Statistics tab. Pairwise identity scores ranged from 99.8 to 100%, with coverage ranging from 22 to 1625 reads (Table S1). These results indicate that the Bd strains compared here have little or no nucleotide polymorphisms in the primer sites used for qPCR. Step by Step protocol to estimate ITS1 copy numbers from uncharacterized Batrachochytrium dendrobatidis (Bd) strains 1. Grow Bd in 1 % mTGh agar plates (refer to recipe from [2]) for at least five days. 2. Harvest zoospores by flooding plates with ~10 mL distilled water. Pool zoospores from multiple plates into a single 50 mL vial. 3. Filter zoospore solution with a 10μm filter (Pall Acrodisc syringe filter AP-4001T). 4. Make 1 mL of 5% iodine solution (one part 10% povidone iodine: one part distilled water) to kill and stain zoospores. 5. Vortex zoospores to homogenize the contents of the solution. Take a 50 μL aliquot and combine with 50 μL 5 % iodine solution. Incubate at room temperature for five minutes. 6. Vortex the killed and stained 100 μL aliquot and count both chambers of a hemocytometer. Repeat Step 5 and Step 6 at least three times. Combine results from counts and calculate the number of zoospores per mL in the solution. 7. Make separate 107 zoospore aliquots by diluting the zoospore solution. 8. Centrifuge at high speed (13,000 X g) for five minutes until a zoospore pellet forms. Discard the supernatant. 9. Extract DNA from pellet using 200 μL PrepMan Ultra (refer to protocol by [3]). 10. Measure DNA concentration of each aliquot at least three times using a Qubit® double strand DNA high sensitivity assay (Life Technologies, Inc.). 11. Perform endpoint PCR amplification using primers ITS1-3 Chytr and 5.8S Chytr [3]. 12. Clone amplicons into pGEM-T Easy Vector (Promega) and transform in E. coli competent cells. 13. Verify that bacterial cells incorporated the insert by using blue-white screening. 14. PCR amplify one plasmid using M13 primers and visualize the PCR products on a 1.75% agarose gel. 15. Clean PCR products and Sanger-sequence to obtain the size (in bp) of the ITS1 fragment. 16. Quantify PCR amplicons with the Qubit® to estimate the mass of a fragment containing one single copy of the ITS1/5.8S region. 17. Make a serial dilution of the amplicons to use in the qPCR reaction. This serial dilution will have a 5-log dynamic range starting at 2.0 x 10⁵ copies of ITS1 μL-1. 18. To estimate the number of ITS1 regions in each zoospore standard using qPCR, run the PCR amplicon serial dilution in parallel with zoospore standards (1000 to 0.1). 19. Using the machine settings, estimate ITS1 copy number in the 1000 zoospore standard. Standards with higher zoospore content are more reliable than the one zoospore or 0.1 zoospore standards. References 1. Schloegel LM, Toledo LF, Longcore JE, Greenspan SE, Vieira CA, et al. (2012) Novel, panzootic and hybrid genotypes of amphibian chytridiomycosis associated with the bullfrog trade. Molecular Ecology 21: 5162-5177. 2. Longcore JE, Pessier AP, Nichols DK (1999) Batrachochytrium dendrobatidis gen. et sp. nov., a chytrid pathogenic to amphibians. Mycologia 91: 219-227. 3. Boyle DG, Boyle DB, Olsen V, Morgan JA, Hyatt AD (2004) Rapid quantitative detection of chytridiomycosis (Batrachochytrium dendrobatidis) in amphibian samples using real-time Taqman PCR assay. Diseases of Aquatic Organisms 60: 141-148.
