Lab Handout - Skidmore College
advertisement
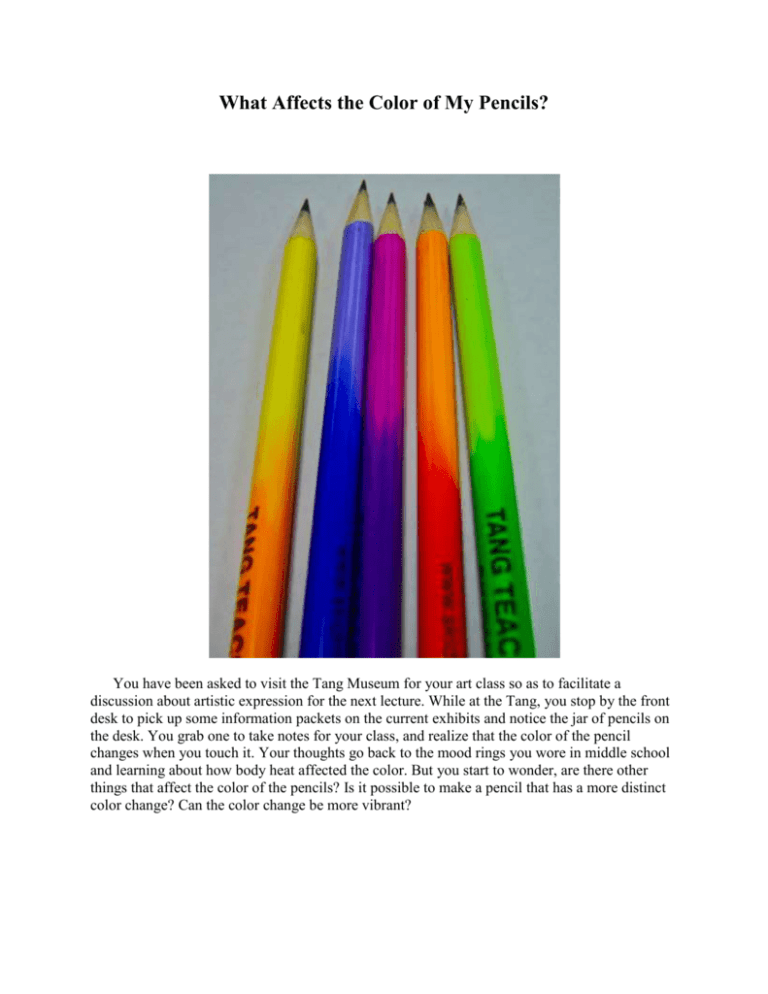
What Affects the Color of My Pencils? You have been asked to visit the Tang Museum for your art class so as to facilitate a discussion about artistic expression for the next lecture. While at the Tang, you stop by the front desk to pick up some information packets on the current exhibits and notice the jar of pencils on the desk. You grab one to take notes for your class, and realize that the color of the pencil changes when you touch it. Your thoughts go back to the mood rings you wore in middle school and learning about how body heat affected the color. But you start to wonder, are there other things that affect the color of the pencils? Is it possible to make a pencil that has a more distinct color change? Can the color change be more vibrant? Background So far this semester every experiment that we have done that involves equilibrium has been conducted at a constant temperature. But what happens to the equilibrium when the temperature changes? Based on LeChatelier's principle we know that equilibrium should shift when the temperature changes but what does that mean? To help us figure that out, we are going to look at the complexation reaction of xylenol orange, an organic molecule that is yellow in the absence of aluminum ions (H4Q) and red when complexed to aluminum (AlQ-). H 4 Q (yellow) Al 3 AlQ - (red) 4 H (1) To measure the extent of the reaction, the concentrations of all of the components of the reaction at equilibrium must be determined. Because there is a color change from the initial reactants (yellow) to the final products (red), the equilibrium concentrations of the reaction components can be calculated by examining the solution in a spectrophotometer through the visible light region. To determine the concentrations of solutions from the absorbance at a specific wavelength, the Beer-Lambert Law will again be used. As you recall, the Beer-Lambert Law states that the absorbance is directly proportional to the molar absorptivity or molar extinction coefficient (L/(mol cm)), , the cell path length (cm), l, and the concentration (mol/L), c, as described by A lc (2) Because the red solution will have an absorbance around 550 nm, the complexation of the xylenol orange with aluminum can be observed by monitoring the absorbance values at that wavelength. At 550 nm, mostly red product is detected, but there is some absorbance from the initial starting material. Because both the product and reactant are factored into the absorbance at 550 nm, the total absorbance is the sum of the contributions A 1l [H 4 Q] 2 l [AlQ - ] (3) where 1 and 2 are the extinction coefficients for [H4Q] and [AlQ-], respectively. To simplify the equation, the path length for the cells in the absorbance measurements has been set to 1 cm (the ‘l’ term becomes 1 and drops out). When we determined the equilibrium constant for Fe(SCN)2+ formation, we zeroed the spectrophotometer with the Fe3+ solution so that all of the measured absorbance was due to the product and then used a standard curve to calculate [Fe(SCN)2+]. This time we won't be able to use a blank or a standard curve because we will be measuring at multiple temperatures. How then will we determine the concentration of at least one chemical species? Although [H4Q] and [AlQ-] seem to both be unknown values, the equation can be further simplified, as we do know the initial concentration of [H4Q]. From the conservation of mass, the initial concentration of H4Q must equal the sum of the concentrations of H4Q and AlQ- at equilibrium [H 4 Q]initial [H 4 Q] [AlQ - ] (4) When the fourth equation is rearranged for [H4Q] and combined with the third equation, the total absorbance is described by A 1 [H 4 Q]initial ( 2 - 1 )[AlQ - ] (5) Because there is essentially no complex [AlQ-] before the reaction is heated, A initial 1[H 4 Q]initial (6) Further simplification of equation 5 can be made by substituting in Ainitial for 1[H 4Q]initial and rearranging the equation. Therefore, at equilibrium the concentration of the aluminum complex can be described by [AlQ - ] (A - A initial ) ( 2 - 1 ) (7) Previous experiments, using a spectrophotometer, have determined the value of ( 2 - 1 ) to be 2.50 × 10⁴ L/ mol ×cm. Once this information is used to calculate the concentration of AlQ-, the concentrations of H4Q and Al3+ at equilibrium can be calculated based on the conservation of mass. The concentration of Al3+ is described by [Al 3 ]equil [Al 3 ]initial [AlQ - ]equil. (8) Because a buffer is used to control the pH of the solution, the concentration of H+ remains constant throughout the reaction and can be calculated from the pH. Procedure1 Note: You will be assigned one of three ratios of reagents. Check Blackboard for your assignment and adapt your procedure and tables accordingly. 1. Start heating approximately 500 mL of water in a 600 mL beaker on a hot plate to boiling. Do not measure the temperature of the water. 2. Using volumetric pipettes, prepare 15-20 mL of your assigned reaction mixture in a test tube, mixing thoroughly with a thermometer. 3. Obtain an initial absorbance for the unheated reaction mixture using a spectrophotometer as follows: a) Set the wavelength to 550 nm and blank the spectrophotometer with DI water as the reference. b) Measure the temperature of the solution. c) Replace the water in the cuvet with a sample of your solution. Measure the absorbance at 550 nm. d) After measuring the initial absorbance, leave the cuvet in the spectrophotometer. Remove the sample from the cuvet with a transfer pipet and return it to the test tube. Remix the solution with the thermometer. 4. Attach a clamp to a ring stand and mount the reaction tube containing your mixture in the beaker of hot water and insert a thermometer in the test tube to monitor the temperature. As the solution is heating, stir it frequently with the thermometer. 5. Create a calorimeter by placing a pair of nested coffee cups into a large beaker. Cover the cups with a lid that has a hole big enough to accommodate the test tube. 6. When the reaction solution has reached 100 C, turn off the hot plate and add boiling water to the calorimeter until the water level is 1-2 cm from the rim. Quickly place the lid on top of the coffee cups and insert the test tube into the appropriate hole in the lid. Leave the thermometer in the solution and use it to stir the solution frequently throughout the rest of the experiment. 7. Transport the calorimeter to the spectrophotometer and record the absorbance at 550 nm of the heated solution as follows: Note: Steps b & c must be completed as quickly as possible to minimize cooling and obtain an accurate absorbance. a) Suck solution in and out of the transfer pipet to equilibrate the temperatures of the pipet and solution. b) Transfer a portion of the solution to the cuvet in the spectrophotometer noting the exact temperature of the solution when it is removed from the test tube (>90 C for the first reading). c) The absorbance will decrease rapidly as the solution cools in the cuvet so as soon as the cover is closed, record the absorbance. d) Return the solution to the test tube in the same manner as in step 3d. 8. Repeat step 7 at 5 C intervals as the solution slowly cools until a total of seven readings for the heated solution have been recorded. Data Collection In your notebook, include the following tables: Table 1. Absorbance measurements for the complexation reaction of xylenol orange and aluminum at __________ (reaction ratio). absorbance at 550 nm corrected absorbance temperature (C) temperature (K) Table 2. Calculations for the determination of the equilibrium constant, K. [AlQ-] [H4Q] [Al3+] [H+] K (equilibrium constant) NA Calculations and In Class Analysis 1. Before coming to lab, calculate the following and show the calculations in your notebook: a. initial concentration of Al3+ b. initial concentration of H4Q c. concentration of H+ from the pH, (all solutions are prepared in buffer that has a pH of 2.00) 2. In class calculations: a. For table 1 show the following for row 2 or row 3: i. temperature in Kelvin ii. corrected absorbance b. Complete all the calculations necessary for filling in table 2 using Excel to do the calculations. However, you must show one example of each of the following for one temperature (80-95 C) in your notebook (partners must show different calculations): i. equilibrium [AlQ-] from the absorbance ii. equilibrium [H4Q] iii. equilibrium [Al3+] iv. Keq 3. Graph the –ln (Keq) as a function of inverse temperature in Kelvin. Reference 1. Adapted from Thermodynamics and Equilibrium In Introduction to Equilibrium and Reactivity, CH-231 Lab Manual; College of the Holy Cross, Spring 2009.
