Indonesia Economy QCAA G20 Interactive map resource
advertisement
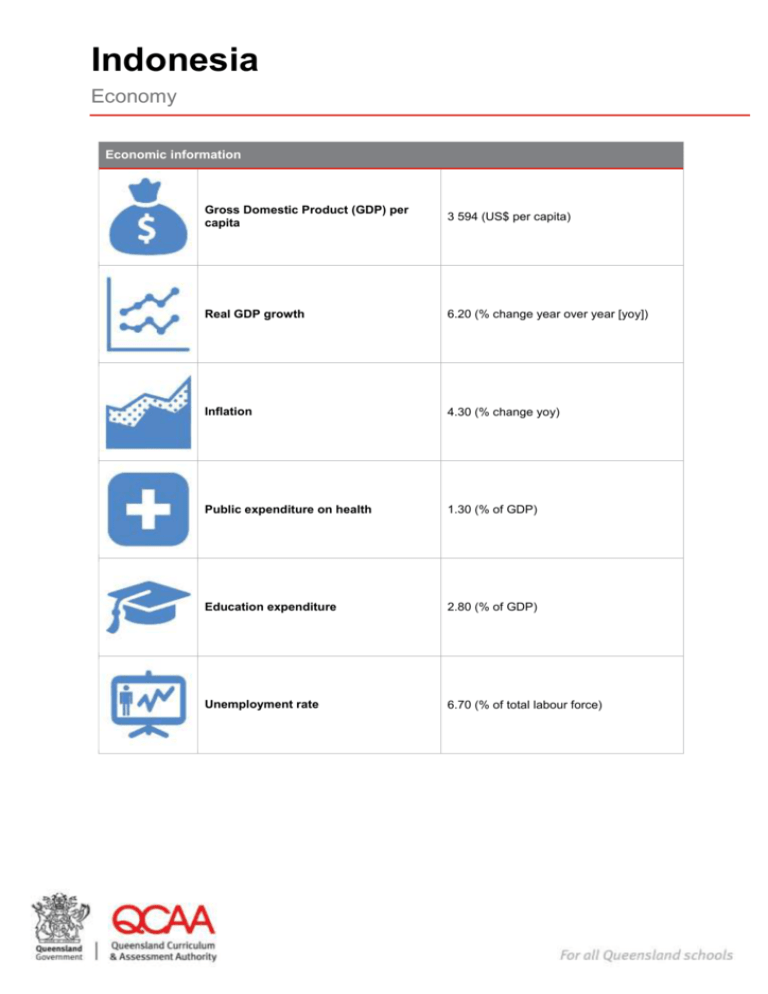
Indonesia Economy Economic information Gross Domestic Product (GDP) per capita 3 594 (US$ per capita) Real GDP growth 6.20 (% change year over year [yoy]) Inflation 4.30 (% change yoy) Public expenditure on health 1.30 (% of GDP) Education expenditure 2.80 (% of GDP) Unemployment rate 6.70 (% of total labour force) Major imports Major Australian imports from Indonesia: Crude petroleum 2 386 000 000 (A$) Gold 553 000 000 (A$) Iron, steel and aluminium structures 361 000 000 (A$) Refined petroleum 301 000 000 (A$) Indonesia’s major import sources: China (1st) 15.30% Singapore (2nd) 13.60% Japan (3rd) 11.90% Australia (8th) 2.80% Major exports Major Australian exports to Indonesia: Wheat 1 395 000 000 (A$) Crude petroleum 300 000 000 (A$) Aluminium 272 000 000 (A$) Cotton 220 000 000 (A$) Indonesia’s major export sources: Japan (1st) 15.90% China (2nd) 11.40% Singapore (3rd) 9.00% Australia (10th) 2.60% Indonesia Economy Queensland Curriculum & Assessment Authority July 2014 Page 2 of 3 Credits The G20 interactive map and resources were developed using information from the following sources (using the most recent data available at the time of publication): Department of Foreign Affairs and Trade (DFAT) 2013, country fact sheets, www.dfat.gov.au. The Organisation for Economic Co-operation and Development (OECD) 2014, statistics, www.oecd.org. The World Bank 2014, data by country, http://data.worldbank.org/country. Central Intelligence Agency (CIA) 2014, World Fact Book, https://www.cia.gov/library/publications/the-world-factbook. Indonesia Economy Queensland Curriculum & Assessment Authority July 2014 Page 3 of 3
