technical comments
advertisement
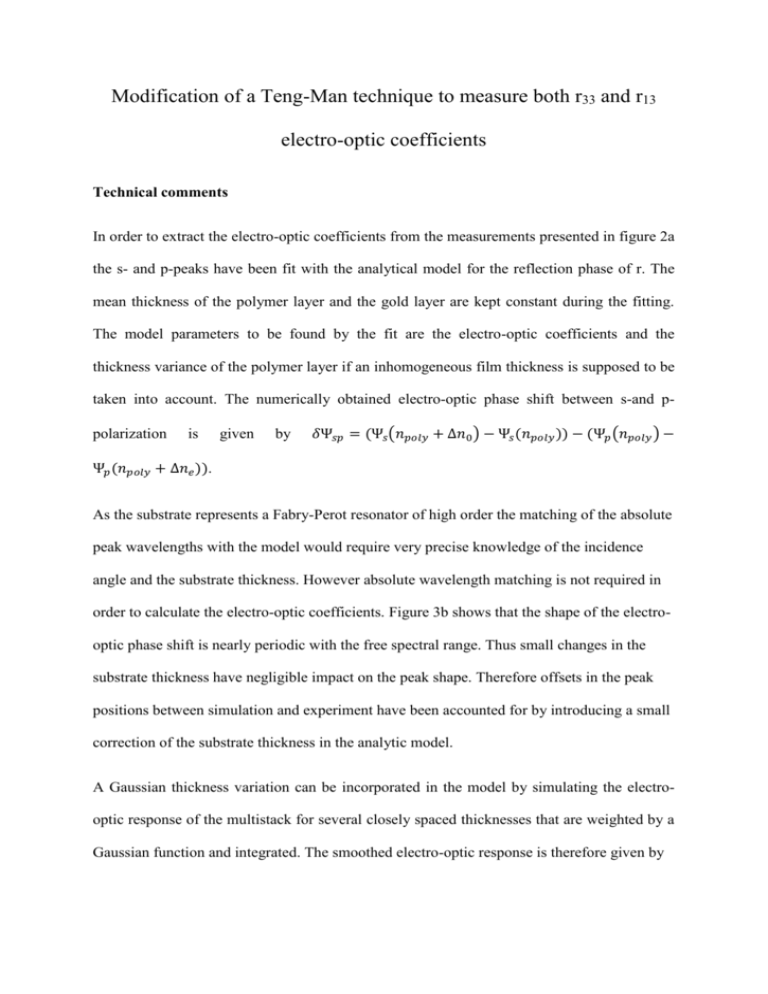
Modification of a Teng-Man technique to measure both r33 and r13 electro-optic coefficients Technical comments In order to extract the electro-optic coefficients from the measurements presented in figure 2a the s- and p-peaks have been fit with the analytical model for the reflection phase of r. The mean thickness of the polymer layer and the gold layer are kept constant during the fitting. The model parameters to be found by the fit are the electro-optic coefficients and the thickness variance of the polymer layer if an inhomogeneous film thickness is supposed to be taken into account. The numerically obtained electro-optic phase shift between s-and ppolarization is given by 𝛿Ψ𝑠𝑝 = (Ψ𝑠 (𝑛𝑝𝑜𝑙𝑦 + ∆𝑛0 ) − Ψ𝑠 (𝑛𝑝𝑜𝑙𝑦 )) − (Ψ𝑝 (𝑛𝑝𝑜𝑙𝑦 ) − Ψ𝑝 (𝑛𝑝𝑜𝑙𝑦 + ∆𝑛𝑒 )). As the substrate represents a Fabry-Perot resonator of high order the matching of the absolute peak wavelengths with the model would require very precise knowledge of the incidence angle and the substrate thickness. However absolute wavelength matching is not required in order to calculate the electro-optic coefficients. Figure 3b shows that the shape of the electrooptic phase shift is nearly periodic with the free spectral range. Thus small changes in the substrate thickness have negligible impact on the peak shape. Therefore offsets in the peak positions between simulation and experiment have been accounted for by introducing a small correction of the substrate thickness in the analytic model. A Gaussian thickness variation can be incorporated in the model by simulating the electrooptic response of the multistack for several closely spaced thicknesses that are weighted by a Gaussian function and integrated. The smoothed electro-optic response is therefore given by ̅̅̅̅̅̅̅ 𝛿𝚿𝒔𝒑 (𝝀) = 𝚫𝒅𝒑𝒐𝒍𝒚 𝝈√𝟐𝝅 𝑵 ∑ (𝒊𝚫𝒅𝒑𝒐𝒍𝒚 )𝟐 − ̅ 𝒑𝒐𝒍𝒚 + 𝒊𝚫𝒅𝒑𝒐𝒍𝒚 ) 𝒆 𝟐𝝈𝟐 𝛿𝚿𝒔𝒑 (𝝀, 𝒅 𝒊=−𝑵 where Δd was chosen to be 1 nm, well below σ and N was chosen to be round(2σ/ Δd). As a starting point for the fitting procedure the thickness variance is set to the value estimated from the thickness measurements. Furthermore the ratio of r33 and r13 is assumed to be three leaving only r33 as free parameter for the first fitting step. Next the r33 is set such that the average electro-optic phase shift in the model and in the experiment are the same. The average phase shift is calculated by taking the mean value of the phase shift 𝛿Ψ𝑠𝑝 for one free spectral range of the Fabry-Perot resonator. Using these values as a starting point for the fit the width of the peaks can be adjusted by changing the thickness variance in the model. Finally the height of the peaks for s- and ppolarization is fit by adjusting the values for r33 and r13 manually while keeping the average phase shift constant.
