Using Matrix Algebra to do Multiple Regression
Before we had computers to assist us, we relied on matrix algebra to solve
multiple regressions. You have some appreciation of how much arithmetic is involved in
matrix algebra, so you can imagine how tedious the solution is. We shall use SAS to do
that arithmetic for us. Consider the research I have done involving the relationship
between a person’s attitudes about animals, idealism, and misanthropy. I also have, for
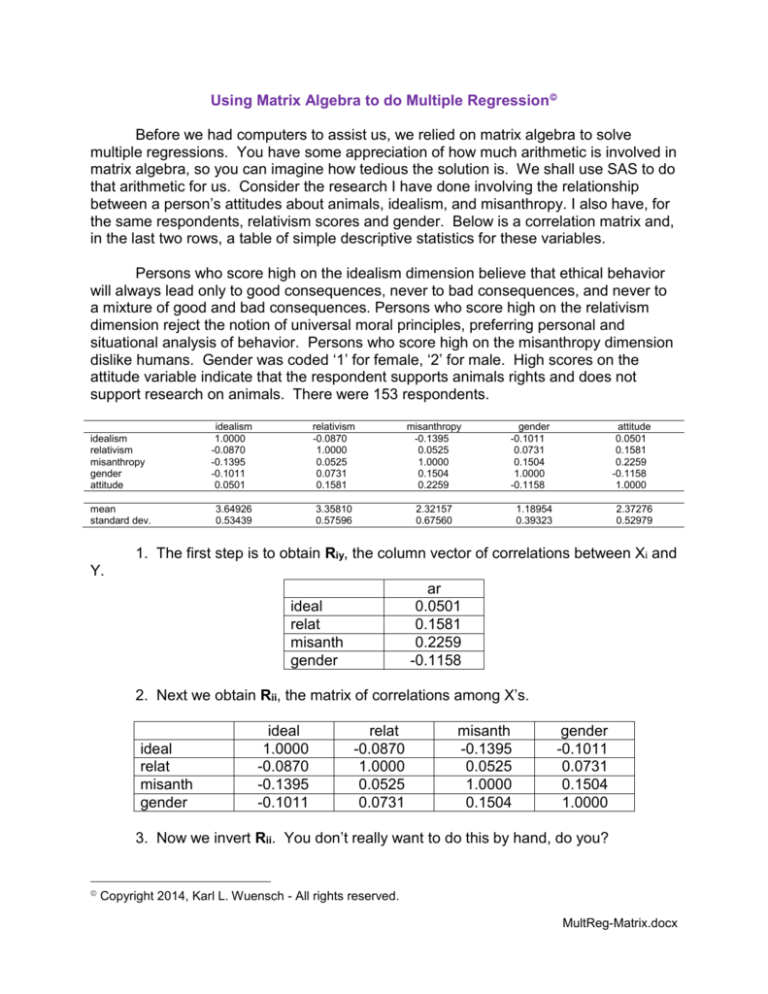
the same respondents, relativism scores and gender. Below is a correlation matrix and,
in the last two rows, a table of simple descriptive statistics for these variables.
Persons who score high on the idealism dimension believe that ethical behavior
will always lead only to good consequences, never to bad consequences, and never to
a mixture of good and bad consequences. Persons who score high on the relativism
dimension reject the notion of universal moral principles, preferring personal and
situational analysis of behavior. Persons who score high on the misanthropy dimension
dislike humans. Gender was coded ‘1’ for female, ‘2’ for male. High scores on the
attitude variable indicate that the respondent supports animals rights and does not
support research on animals. There were 153 respondents.
idealism
relativism
misanthropy
gender
attitude
mean
standard dev.
idealism
1.0000
-0.0870
-0.1395
-0.1011
0.0501
relativism
-0.0870
1.0000
0.0525
0.0731
0.1581
misanthropy
-0.1395
0.0525
1.0000
0.1504
0.2259
3.64926
0.53439
3.35810
0.57596
2.32157
0.67560
gender
-0.1011
0.0731
0.1504
1.0000
-0.1158
attitude
0.0501
0.1581
0.2259
-0.1158
1.0000
1.18954
0.39323
2.37276
0.52979
1. The first step is to obtain Riy, the column vector of correlations between Xi and
Y.
ar
0.0501
0.1581
0.2259
-0.1158
ideal
relat
misanth
gender
2. Next we obtain Rii, the matrix of correlations among X’s.
ideal
relat
misanth
gender
ideal
1.0000
-0.0870
-0.1395
-0.1011
relat
-0.0870
1.0000
0.0525
0.0731
misanth
-0.1395
0.0525
1.0000
0.1504
gender
-0.1011
0.0731
0.1504
1.0000
3. Now we invert Rii. You don’t really want to do this by hand, do you?
Copyright 2014, Karl L. Wuensch - All rights reserved.
MultReg-Matrix.docx
4. Now R ii1R iy Bi -- that is, we post multiply the inverted X correlation matrix by
the XY correlation vector to get the partial regression coefficients in standardized form
[]. Since we don’t want to do that by hand either, we employ IML in SAS. Copy this
little program into the SAS editor, submit it, and see the resulting matrices:
proc iml;
reset print;
ii ={
1.0000 -0.0870 -0.1395 -0.1011,
-0.0870 1.0000 0.0525 0.0731,
-0.1395 0.0525 1.0000 0.1504,
-0.1011 0.0731 0.1504 1.0000};
iy = {0.0501, 0.1581, 0.2259, -0.1158};
betas = inv(ii)*iy;
quit;
In the output window you will see first the Riy, then the Rii, and finally the column
vector of Beta weights. The first beta is for idealism, the second relativism, the third
misanthropy, and the last gender.
5. If you want unstandardized coefficients, you need to use the following
formulae:
sy
bi i
a Y bi X i
si
6. To obtain the squared multiple correlation coefficient, R 2 r1 . For our
data, that is 0.0501(.0837) + 0.1581(.1636) + 0.2259(.2526) + (-0.1158)(-.1573) =
.1053.
7. Test the significance of the R2
For our data, sy = 0.52979, n = 153, so SSY = 152(0.52979)2 = 42.663.
The regression sum of squares, SSregr R 2SSY .1053(42.663) 4.492
The error sum of squares, SSerror SSY SSregr 42.663 4.492 38.171
SS
df
MS
F
Source
Regression
4.492
4 1.123 4.353
Residual
38.171
148 0.258
Total
42.663
152
This is significant at about .002. We could go on to obtain test the significance of
the partials and obtain partial or semipartial correlation coefficients, but frankly, that is
just more arithmetic than I can stand. Let us stop at this point. The main objective of
this handout is to help you appreciate how matrices and matrix algebra are essential
when computing multiple regressions, and I hope that I have already made that point
adequately.
At http://www.danielsoper.com/statcalc3/calc.aspx?id=15 is a web app that will
calculate F and p given the R2 and N. Rounding error will produce a small discrepancy
between the values it obtains and those shown here.


