Electronic Supplementary Material
advertisement
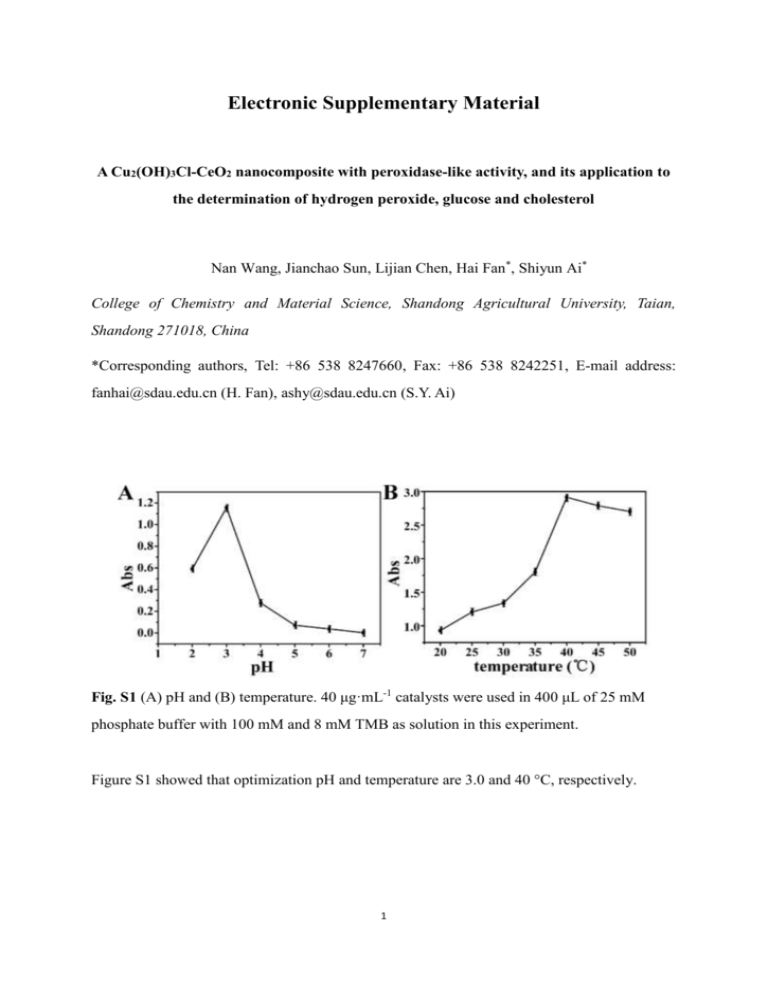
Electronic Supplementary Material A Cu2(OH)3Cl-CeO2 nanocomposite with peroxidase-like activity, and its application to the determination of hydrogen peroxide, glucose and cholesterol Nan Wang, Jianchao Sun, Lijian Chen, Hai Fan*, Shiyun Ai* College of Chemistry and Material Science, Shandong Agricultural University, Taian, Shandong 271018, China *Corresponding authors, Tel: +86 538 8247660, Fax: +86 538 8242251, E-mail address: fanhai@sdau.edu.cn (H. Fan), ashy@sdau.edu.cn (S.Y. Ai) Fig. S1 (A) pH and (B) temperature. 40 μg·mL-1 catalysts were used in 400 μL of 25 mM phosphate buffer with 100 mM and 8 mM TMB as solution in this experiment. Figure S1 showed that optimization pH and temperature are 3.0 and 40 °C, respectively. 1 Fig. S2 Steady-state kinetic assay. Double reciprocal plots of activity of material with the concentration of one substrate (TMB or H2O2) fixed and the other changed. The velocity (V) of the reaction was tested using 40 mg·mL-1 material in 400 μL of 25 mM phosphate buffer (pH 3.0) at room temperature. Figure S2 showed that the slopes are similar and conform to the Ping-Pong mechanism. Table S1 The data of linear equations and R2 TMB (mM) H2O2 (mM) equation R2 2 Y=16.821x-1.520 0.965 4 Y=8.746x-0.052 0.973 8 Y=11.529x+37.264 0.909 8 Y=12.034x-9.098 0.999 10 Y=11.925x-12.180 0.991 12 Y=10.886x-12.184 0.985 2 Fig. S3 (A) Absorbance spectra of TMB reaction solutions catalyzed by material in the presence of different concentration of glucose in 25 mM phosphate buffer (pH 3.0) at the room temperature. (B) A dose-response curve for glucose detection. Inset: linear calibration plot for glucose. (C) Absorbance spectra of TMB reaction solutions catalyzed by material in the presence of different concentration of cholesterol in 25 mM phosphate buffer (pH 3.0) at the room temperature. (D) A dose-response curve for cholesterol detection. Inset: linear calibration plot for cholesterol. The error bars shown are the standard errors derived from three measurements. Figure S3 showed that glucose can be detected as low as 0.05 mM and the linear range was from 0.1 mM to 2 mM and cholesterol can be detected as low as 0.05 mM and the linear range was from 0.1 mM to 2 mM. Table S2 The data of equation and R2 of H2O2, glucose and cholesterol. equation R2 H2O2 Y=0.00797x-0.0137 0.996 Glucose Y=0.00248x+0.00943 0.991 Cholesterol Y=0.00243x+0.0016 0.990 3 Table S3 Figures of merit of comparable nanomaterials with peroxidase like activity for H2O2. Materials Effects of pH Analytical ranges (mM) LODs (μmol L-1) Methods Reference Cu2(OH)3Cl-CeO2 3.0 0.02-0.05 0.11 photochemical - magnetoferritin 8.6 5.8-88.2 9.63 electrochemical [1] AgNPs/PQ11/graphene 7.0 0.1-4 - electrochemical [2] Table S4 Comparison of the kinetic parameters of Cu2(OH)3Cl-CeO2 and HRP catalyst Substrate Km (mM) Vm (10-8M/s) Cu2(OH)3Cl-CeO2 H2O2 11.61 8.15 TMB 12.36 10.62 H2O2 3.99 8.71 TMB 0.434 10 HRP[3] References 1. Melnikova L, Pospiskova K, Mitroova Z, Kopcansky P, Safarik I (2014) Peroxidase-like activity of magnetoferritin. Microchim Acta 181 (3-4):295-301 2. Liu S, Tian J, Wang L, Li H, Zhang Y, Sun X (2010) Stable aqueous dispersion of graphene nanosheets: noncovalent functionalization by a polymeric reducing agent and their subsequent decoration with Ag nanoparticles for enzymeless hydrogen peroxide detection. Macromolecules 43 (23):10078-10083 3. Gao L, Zhuang J, Nie L, Zhang J, Zhang Y, Gu N, Wang T, Feng J, Yang D, Perrett S, Yan X (2007) Intrinsic peroxidase-like activity of ferromagnetic nanoparticles. Nat Nanotechnol 2 (9):577-583. doi:10.1038/nnano.2007.260 4
