Pollen Background
advertisement
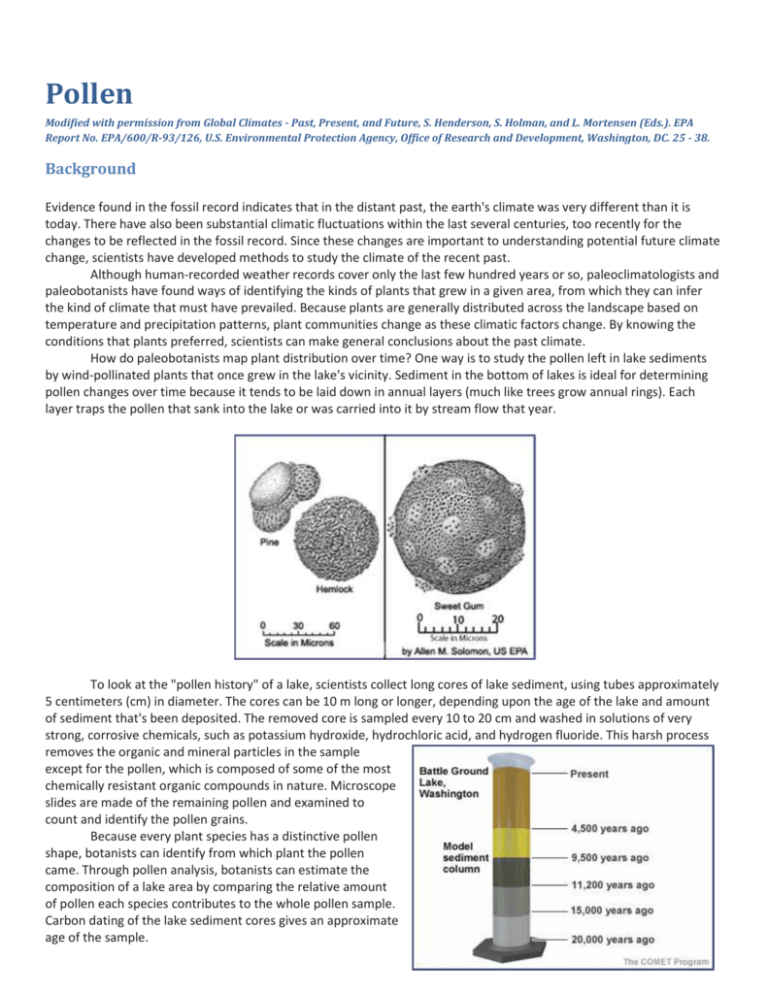
Pollen Modified with permission from Global Climates - Past, Present, and Future, S. Henderson, S. Holman, and L. Mortensen (Eds.). EPA Report No. EPA/600/R-93/126, U.S. Environmental Protection Agency, Office of Research and Development, Washington, DC. 25 - 38. Background Evidence found in the fossil record indicates that in the distant past, the earth's climate was very different than it is today. There have also been substantial climatic fluctuations within the last several centuries, too recently for the changes to be reflected in the fossil record. Since these changes are important to understanding potential future climate change, scientists have developed methods to study the climate of the recent past. Although human-recorded weather records cover only the last few hundred years or so, paleoclimatologists and paleobotanists have found ways of identifying the kinds of plants that grew in a given area, from which they can infer the kind of climate that must have prevailed. Because plants are generally distributed across the landscape based on temperature and precipitation patterns, plant communities change as these climatic factors change. By knowing the conditions that plants preferred, scientists can make general conclusions about the past climate. How do paleobotanists map plant distribution over time? One way is to study the pollen left in lake sediments by wind-pollinated plants that once grew in the lake's vicinity. Sediment in the bottom of lakes is ideal for determining pollen changes over time because it tends to be laid down in annual layers (much like trees grow annual rings). Each layer traps the pollen that sank into the lake or was carried into it by stream flow that year. To look at the "pollen history" of a lake, scientists collect long cores of lake sediment, using tubes approximately 5 centimeters (cm) in diameter. The cores can be 10 m long or longer, depending upon the age of the lake and amount of sediment that's been deposited. The removed core is sampled every 10 to 20 cm and washed in solutions of very strong, corrosive chemicals, such as potassium hydroxide, hydrochloric acid, and hydrogen fluoride. This harsh process removes the organic and mineral particles in the sample except for the pollen, which is composed of some of the most chemically resistant organic compounds in nature. Microscope slides are made of the remaining pollen and examined to count and identify the pollen grains. Because every plant species has a distinctive pollen shape, botanists can identify from which plant the pollen came. Through pollen analysis, botanists can estimate the composition of a lake area by comparing the relative amount of pollen each species contributes to the whole pollen sample. Carbon dating of the lake sediment cores gives an approximate age of the sample. Scientists can infer the climate of the layer being studied by relating it to the current climatic preferences of the same plants. For example, they can infer that a sediment layer with large amounts of western red cedar pollen was deposited during a cool, wet climatic period, because those are the current conditions most conducive to the growth of that species. Why are scientists who study climate change interested in past climates? First, by examining the pattern of plant changes over time, they can determine how long it took for plant species to migrate into or out of a given area due to natural processes of climate change. This information makes it easier to predict the speed with which plant communities might change in response to future climate change. Second, by determining the kinds of plants that existed in an area when the climate was warmer than at present, scientists can more accurately predict which plants will be most likely to thrive if the climate warms again. Data: July Avg. Temperature (C) July Normalized Temp Celcius Annual Precipitation (cm) 13.97 11.03 93.09 31.9064 263 7 0.974 14.11 10.89 91.70 33.3036 130 16 0.890 14.30 10.70 89.75 35.2497 223 9 0.961 14.85 10.15 84.26 40.7387 152 30 0.835 15.34 9.66 92.77 32.2277 151 38 0.799 15.43 9.57 92.26 32.7443 254 10 0.962 17.56 7.44 112.18 12.81635 266 24 0.917 17.62 7.38 100.91 24.09472 172 26 0.869 17.62 7.38 100.91 24.09472 235 15 0.940 15.64 9.36 76.33 48.6728 107 6 0.947 14.29 10.71 97.83 27.16534 356 3 0.992 15.82 9.18 107.57 17.4253 229 32 0.877 16.40 8.60 66.27 58.72716577 256 8 0.970 15.44 9.56 91.91 33.09454 287 3 0.990 16.98 8.02 83.33 41.67 189 18 0.913 16.98 8.02 83.33 41.67 199 15 0.930 19.38 5.62 123.56 1.444990088 92 37 0.713 16.76 8.24 85.17 39.82564 261 6 0.978 16.76 8.24 85.17 39.82564 234 10 0.959 16.77 8.23 85.10 39.89854 158 4 0.975 20.10 4.90 73.31 51.695 4 42 0.087 19.60 5.40 76.80 48.2015 111 103 0.519 19.41 5.59 69.32 55.6756 50 153 0.246 20.53 4.47 95.88 29.1210478 67 62 0.519 20.59 4.41 69.79 55.214 173 74 0.700 20.97 4.03 86.96 38.03667472 25 200 0.111 20.98 4.02 86.75 38.24513645 10 291 0.033 21.01 3.99 86.13 38.86752816 122 25 0.830 22.37 2.63 70.28 54.72408535 56 123 0.313 22.72 2.28 68.09 56.90659 10 54 0.156 21.01 3.99 86.13 38.86752816 30 44 0.405 21.03 3.97 85.79 39.21136991 35 73 0.324 21.21 3.79 82.42 42.57519021 21 65 0.244 22.12 2.88 59.03 65.975 16 9 0.640 22.15 2.85 58.85 66.1535 158 31 0.836 Normalized Precp (cm) Sum Pine Sum Oak Ratio P:O 22.78 2.22 64.58 60.42049 9 159 0.054 22.33 2.67 57.52 67.4795 2 214 0.009 22.27 2.73 65.20 59.79823877 6 90 0.063 22.38 2.62 57.21 67.7855 2 41 0.047 23.26 1.74 52.37 72.63248369 6 24 0.200 22.49 2.51 27.94 97.06 9 4 0.692 ** Pine: Oak ratio is more like a gradient, where 0 represents Pine and 1 represents Oak** Questions: 1. Graph the Pine : Oak ratios against normalized temperature and in a separate graph against normalized precipitation. ***Be sure to include a trend line and r2 value for each variable*** 2. Determine the ratio of trees at various temperature and precipitations. Decipher trends and record observations. 3. What conclusions can be made about the environments of the two tree species? (hint: think temperature and precipitation). Use 3 pieces of evidences from your research to support your ideas. 4. How can present day data such as this be use by paleoclimatologists to reconstruct past climates? (see below diagram) 5. What are the limitations of this source of information? This may be a helpful tool for predicting where certain trees grow based on climate. Resources: http://www.ncdc.noaa.gov/paleo/pollen/viewer/webviewer.html Budburst http://www.ncdc.noaa.gov/paleo/pollen.html http://www.esd.ornl.gov/projects/qen/nerc.html http://www.esd.ornl.gov/projects/qen/adams3.html http://www.ucar.edu/learn/1_2_2_10t.htm
