06A Types of Maps WS - Educational Excellence
advertisement
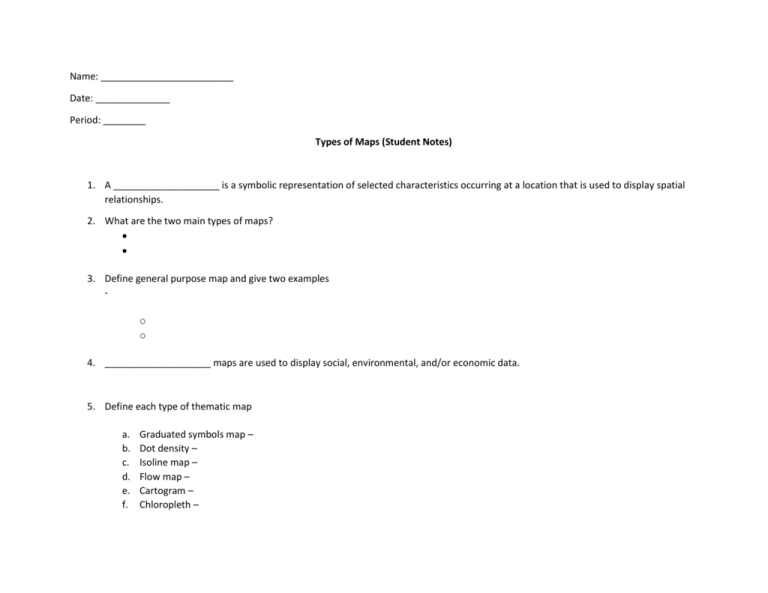
Name: _________________________ Date: ______________ Period: ________ Types of Maps (Student Notes) 1. A ____________________ is a symbolic representation of selected characteristics occurring at a location that is used to display spatial relationships. 2. What are the two main types of maps? 3. Define general purpose map and give two examples o o 4. ____________________ maps are used to display social, environmental, and/or economic data. 5. Define each type of thematic map a. b. c. d. e. f. Graduated symbols map – Dot density – Isoline map – Flow map – Cartogram – Chloropleth – Name: _________________________ Date: ______________ Period: ________ Types of Maps (Student Activity) – Venn Diagram Name: _________________________ Date: ______________ Period: ________ Types of Maps (Student Activity) – Double Bubble Name: _________________________ Date: ______________ Period: ________ Types of Maps (Student Evaluation) 1. A cartographer needs to make a map that displays regional differences in temperatures. What would be the best map to use? Explain why. 2. Describe the differences and similarities between a graduated symbols map and a cartogram. 3. _________________ maps show movement of objects between locations. 4. __________________ maps use shades of color to represent numerical values (ranges, ratios, proportions, etc…). 5. A ________________________ is a person who makes a map. Date: ______________ Period: ________ KEY Types of Maps (Student Notes) KEY c 6 A 6. A _____map___________ is a symbolic representation of selected characteristics occurring at a location that is used to display spatial relationships. 7. What are the two main types of maps? General Purpose Map Thematic Map 8. Define general purpose map and give two examples Shows location of specific objects or boundaries o o Road Map Political Map 9. _________Thematic___________ maps are used to display social, environmental, and/or economic data. 10. Define each type of thematic map a. b. c. d. e. f. Graduated symbols map – use symbols to display quantity or magnitude Dot density – shows a concentration of points that represent a feature of interest Isoline map – use continuous lines to show regional differences Flow map – show movement of objects between locations Cartogram – distorts shape of a region to represent magnitude Chloropleth map – use shades of color to represent numerical ranges, ratios, etc… Name: _________________________ Date: ______________ Period: ________ Types of Maps (Student Activity) – Venn Diagram Name: _________________________ Date: ______________ Period: ________ Types of Maps (Student Activity) – Double Bubble Name: _________________________ Date: ______________ Period: ________ Types of Maps (Student Evaluation) 6. A cartographer needs to make a map that displays regional differences in temperatures. What would be the best map to use? Explain why. Temperature data trends fairly linearly as you move from the equator to the poles, thus, an isoline map would be the best to use because you can connect areas of similar temperatures using continuous isolines. 7. Describe the differences and similarities between a graduated symbols map and a cartogram. Differences: Cartograms distort the shape of the region in order to represent the data, while graduated symbols adjust the symbol size not the regional area to represent the data. Scale is maintained on graduated symbols maps, but not on cartograms. Similarities: Both maps are used to show magnitude of the data. Both maps are classified as thematic. 8. _____Flow_________ maps show movement of objects between locations. 9. ________Chloropleth__________ maps use shades of color to represent numerical values (ranges, ratios, proportions, etc…). 10. A ___________cartographer_____________ is a person who makes a map.
