Answers to end of chapter questions
advertisement
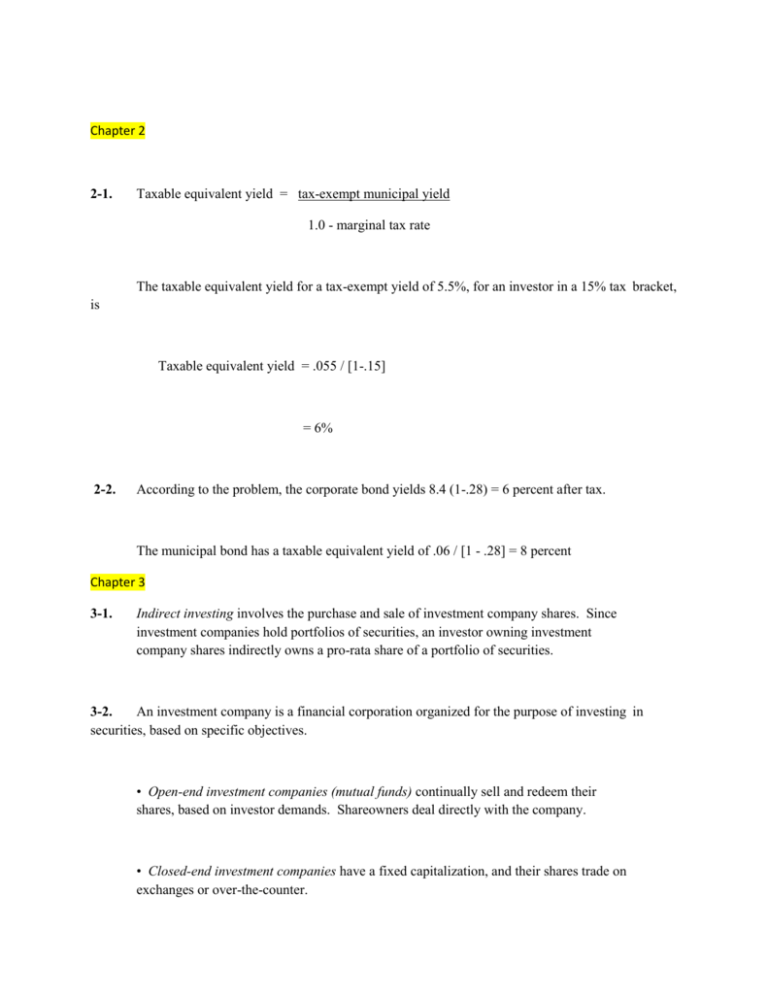
Chapter 2 2-1. Taxable equivalent yield = tax-exempt municipal yield 1.0 - marginal tax rate The taxable equivalent yield for a tax-exempt yield of 5.5%, for an investor in a 15% tax bracket, is Taxable equivalent yield = .055 / [1-.15] = 6% 2-2. According to the problem, the corporate bond yields 8.4 (1-.28) = 6 percent after tax. The municipal bond has a taxable equivalent yield of .06 / [1 - .28] = 8 percent Chapter 3 3-1. Indirect investing involves the purchase and sale of investment company shares. Since investment companies hold portfolios of securities, an investor owning investment company shares indirectly owns a pro-rata share of a portfolio of securities. 3-2. An investment company is a financial corporation organized for the purpose of investing in securities, based on specific objectives. • Open-end investment companies (mutual funds) continually sell and redeem their shares, based on investor demands. Shareowners deal directly with the company. • Closed-end investment companies have a fixed capitalization, and their shares trade on exchanges or over-the-counter. 3-3. “Open-end” means that the number of shares of the mutual fund outstanding is not fixed. Rather, the number of shares varies as investors buy shares from the mutual fund company and redeem shares back to the mutual fund company. Chapter 4 4-1. Financial markets are essential for both businesses and governments in raising capital to finance their operations. Both experience demands for funds that are not in balance with their actual funds on hand. Financial markets are absolutely essential to the functioning of our capitalistic economy. Technically, primary markets can exist without secondary markets since new securities can be sold to investors. For example, bonds could be sold to institutional investors to be held until they mature. However, investors would have difficulty reselling these securities if they needed to, and many would be discouraged from buying them because of this reason. 4-2. Investment bankers act as intermediaries between issuers and investors. They provide functions, including: several (1) an advisory function, wherein they offer advice to clients concerning the issuance of new securities; (2) an underwriting function, consisting of the purchase of securities from an issuer and their subsequent sale to investors; (3) a marketing function, involving the sale of the securities to the investing public. 4-3. In a primary offering involving investment bankers, the potential issuer of the securities meets with an investment banking firm for advice on selling the new issue. In a negotiated bid arrangement, these two parties negotiate and work together on the issue. Subsequently, the investment banker, working with other investment banking firms (i.e., a syndicate), underwrites the issue; that is, the investment bankers purchase the securities from the issuer, thereby assuming the risk involved in actually selling the securities. After all legal requirements have been met (e.g., the issue is registered with the SEC), the selling group sells the securities to the public via brokers who contact their customers about the issue. 4-4. The equity markets in the United States consist primarily of the organized exchanges-- the NYSE (which merged with the Amex) and Nasdaq (approved to be an exchange in January, 2006). Over- the-counter securities are now traded on the OTC Bulletin Board or the Pink Sheets LLC. • Auction markets, involving the NYSE Euronext and any regional exchanges, include a bidding (auction) process in a specific physical location with brokers representing buyers and sellers. • The NYSE is now a hybrid market, following its merger with Archipelago, an ECN. • Nasdaq is a negotiated market, where dealers make the market in securities by standing ready to buy from, and sell to, investors based on bid-ask prices. Nasdaq has been approved to be an exchange. 4-5. Commission brokers are members of brokerage houses with memberships on exchanges. They act as brokers for customers. Investment bankers act as middlemen between the issuers of the securities and the purchasers, in the same way that brokers do. Some firms offer both investment banking and retail brokerage services. 4-6. Specialists are members of exchanges who are assigned to particular stocks on an exchange. They are charged by the exchange with maintaining a continuous, orderly market in their assigned stocks. They do this by going against the market, buying (selling) when the public is selling (buying). Specialists act as brokers by executing orders for other brokers for a commission. They act as dealers by buying and selling specific stocks for their own accounts. 4-7. Specialists should be, and are, closely monitored and regulated. Because they maintain the limit books, they have knowledge of all limit orders on either side of the current market price. They are charged with acting for the public interest by maintaining an orderly market; simultaneously, they buy and sell for their own accounts in hopes of profiting from the spread between purchases and sales. Clearly, specialists must be closely regulated because of these potentially conflicting roles. 4-8. A specialist on the exchange often acts as a dealer, buying and selling for his or her own account. Nasdaq market makers may do the same thing. 4-9. NASD stands for the National Association of Security Dealers, a self- regulating body of brokers and dealers that oversaw Nasdaq and OTC practices. NASD licensed brokers and handled the punishment for violators of its prescribed fair practices. The NASD merged with the New York Stock Exchange's regulation committee in 2007, resulting in the Financial Industry Regulatory Authority, or FINRA. Nasdaq is an electronic screen-based equity securities market providing instantaneous transactions as market makers compete for investor orders. 4-10. An ECN is an Electronic Communication Network. Basically, ECNs are fully computerized trading networks that match buy and sell orders from investors without the use of a dealer. 4-15. The Dow-Jones Industrial Average is a price-weighted average of 30 large (blue-chip stocks) trading on the NYSE. The S&P 500 Composite Index is a market value index consisting of 500 stocks, with a base period set to 10 (1941-1943). These measures are the two most often-used indicators of what stocks in general are doing. The Dow-Jones Averages are supported by The Wall Street Journal, while the S&P 500 Index is the indicator most often used by institutional investors. 4-16. Blue chip stocks are large, well-established and well-known companies with long records of earnings and dividends. They are typically traded on the NYSE. Examples include Coca-Cola, General Electric, and Exxon Mobil. 4-17. The EAFE Index, or the European, Australia, and Far East Index, is a value-weighted index of the equity performance of major foreign markets. It is, in effect, a nonAmerican world index. 4-18. Blocks are defined as transactions involving at least 10,000 shares. Large-block activity on the NYSE is an indicator of institutional investor participation in equity trading. The total number of large-block transactions has increased over the years on the NYSE. Chapter 5 5-1. A market order ensures that a customer’s order will be executed quickly, at the best price the broker can obtain. Thus, an investor who wants to be certain of quickly establishing a position in a stock (or getting out of a stock) will probably want to use a market order. A limit order specifies a particular price to be met or bettered. The purchase or sale will occur only if the broker obtains that price, or betters it. Therefore, an investor can attempt to pay no more than a certain price in a purchase, or receive no less than a certain price in a sale; a completed transaction, however, cannot be guaranteed. A stop order specifies a certain price at which a market order takes effect. The exact specified in the stop order is not guaranteed, and may not be realized. price Limit orders are placed on opposite sides of the current market price of a stock from stop orders. For example, while a buy limit order would be placed below a stock’s current market price, a buy stop order would be placed above its current market price. With a wrap account, all costs are wrapped in one fee. Using the broker as a consultant, an outside money manager is chosen by the client from a list provided by the broker. 5-2. The typical investor in a wrap account receives very little attention from a money manager. Most likely, he or she is given some prepackaged portfolio that can be used numerous investors. 5-3. 5-4. Investors use margin accounts to magnify their percentage gains if they make good investing decisions. The risk is that their percentage losses can also be magnified. Margin is the equity that a customer has in a transaction. with The Board of Governors of the Federal Reserve System sets the initial margin, which is the percentage of the value of a securities transaction that the purchaser must pay at the time of the transaction. The purchaser then borrows the remainder from the broker, traditionally paying as interest charges the broker loan rate plus 1-2% (approximately). Completion, however, may result in significantly different rates paid by the customer. In addition to the initial margin, all exchanges and brokers require a maintenance below which the actual margin cannot go (this is typically 30% or more). 5-1. (a) A limit order to sell is placed above the current market price. If the limit order is set at $130, the investor will realize a gross profit of at least $30 (ignoring transaction costs). (b) A sell stop order is placed below the market price. If the stop order is placed at $120, the investor should realize a profit of approximately $20 per share. Technically, to be certain of $20 per share, the stop order probably would have to be set slightly above $120 because a stop price is actually an activator that initiates a market order when the specified price is reached. 5-2. To realize a gross profit of $5000 on 200 shares sold short at $75, the investor must cover at (ignoring transaction costs): 200($75) = $15,000 - X ─────── = $5000 profit X is $10,000, which must be divided by 200 shares. ANSWER: $50 per share margin For a profit of $1000, the calculation is: $15,000 - X ─────── $1000 X is $14,000, which again must be divided by 200 shares. ANSWER: $70 per share. 5-3. 100 shares at $50 per share is a total cost of $5000. At 50% margin, the investor must $2500, resulting in a gross profit percentage relative to equity of put up $1000 / $2500 = 40% At 40% margin, the investor must put up $2000, resulting in a gross profit percentage to equity of relative $1000 / $2000 = 50% At 60% margin, the investor must put up $3000, resulting in a gross profit percentage to equity of relative $1000 / $3000 = 33.3% 5-4. The initial margin is 50% of $6000, or $3000. The other $3000 is borrowed from the broker. (a) market value of securities - amount borrowed actual margin = ─────────────────────────────── market value of securities $5000 - $3000 = ───────────── $5000 = 40% (b) In a restricted account, the actual margin is between the initial margin (i.e., 50%) and the maintenance margin (i.e., 30%). The actual margin is now: market value of securities - amount borrowed actual margin = ───────────────────────────────── market value of securities $5500 - $3000 = ───────────── $5500 = 45.5% Therefore, the account is restricted. (c) A margin call results when the actual margin declines below the maintenance margin. At a stock price of $49, the actual margin is: $4900 - $3000 actual margin = ───────────── $4900 = 38.8% Because the actual margin is not below the maintenance margin of 30%, there is no margin call. (d) At a stock price of $45, the actual margin is $4500 - $3000 actual margin = ───────────── $4500 = 33.3% There is no margin call at a price of $45. At $35, however, the actual margin is $3500 - $3000 actual margin = ──────────── $3500 = 14.3% The amount of the margin call is calculated as: (x + $3500) - $3000 .3 = —————————— (x + $3500) = $785.71 Chapter 6 6-1. Historical returns are realized returns, such as those reported by Ibbotson Associates. Expected returns are returns expected to occur in the future. They are the most likely for the future, although they may not actually be realized because of risk. returns 6-2. A Total Return can be calculated for any asset for any holding period. Both monthly and annual TRs are often calculated, but any desired period of time can be used. 6-3. Total return for any security consists of an income (yield) component and a capital gain (or loss) component. • The yield component relates dividend or interest payments to the price of the security. • The capital gain (loss) component measures the gain or loss in price since the security was purchased. While either component can be zero for a given security over a specified time period, capital change component can be negative. only the 6-4. TR, another name for holding period return, is a decimal or percentage return, such as +.10 or -15%. The term “holding period return” is sometimes used instead of TR. Return relative adds 1.0 to the TR in order that all returns can be stated on the basis of 1.0 (which represents no gain or loss), thereby avoiding negative numbers so that the geometric mean can be calculated. 6-5. The geometric mean is a better measure of the change in wealth over more than a single period. Over multiple periods the geometric mean indicates the compound rate of return, or the rate at which an invested dollar grows, and takes into account the variability in the returns. The geometric mean is always less than the arithmetic mean because it allows for the compounding effect--the earning of interest on interest. 6-6. The arithmetic mean should be used when describing the average rate of return without considering compounding. It is the best estimate of the rate of return for a single period. Thus, in estimating the rate of return for common stocks for next year, we use the arithmetic mean and not the geometric mean. The reason is that because of variability in the returns, we will have to earn, on average, the arithmetic rate in order to achieve a compound rate of growth which is given by the smaller geometric mean. 6-7. 6-8. See Equation 6-11. Knowing the arithmetic mean and the standard deviation for a the geometric mean can be approximated. series, An equity risk premium is the difference between stocks and a risk-free rate (proxied by the return on Treasury bills). It represents the additional compensation, on average, for taking the risk of equities rather than buying Treasury bills. 6-9. As Table 6-6 shows, the risk (standard deviation) of large common stocks was about two and one-half times that of government and corporate bonds. Therefore, common stocks are clearly more risky than bonds, as they should be since larger returns would be expected to be accompanied by larger risks over long periods of time. 6-10. Market risk is the variability in returns due to fluctuations in the overall market. It includes a wide range of factors exogenous to securities themselves. Business risk is the risk of doing business in a particular industry or environment. rate risk and inflation risk are clearly directed related. Interest Interest rates and inflation generally rise and fall together. 6-11. risk. Systematic risk: market risk, interest rate risk, inflation risk, exchange rate risk, and country Nonsystematic risk: business risk, financial risk, and liquidity risk. 6-12. Country risk is the same thing as political risk. It refers to the political and economic stability and viability of a country’s economy. The United States can be used as a benchmark with which to judge other countries on a relative basis. Canada would be considered to have relatively low country risk. Mexico seems to be on the upswing economically, but certainly has its risk in the form of nationalized industries, overpopulation, drug cartels and other issues. Mexico has also experienced a dramatic devaluation of the peso in the past. 6-13. The return on the Japanese investment is now worth less in dollars. Therefore, the investor’s return will be less after the currency adjustment. EXAMPLE: Assume an American investor in the Japanese market has a 30% gain in one year but the Yen declines in value relative to the dollar by 10%. The percentage of the original investment after the currency risk is accounted for is (0.9)(130%) = 117%. Therefore, the investor’s return is 17%, not 30%. In effect, the investor loses 10% on the original wealth plus another 10% on the 30% gain, or a total of 13 percentage points of the before-currency-adjustment return of 130% of investment. 6-14. Risk is the chance that the actual outcome from an investment will differ from the expected outcome. Risk is often associated with the dispersion in the likely outcomes. Dispersion refers to variability, and the standard deviation is a statistical measure of variability or dispersion. Standardization measures risk in an absolute sense. 6-1. Calculating Total Returns (TRs) for these assets: (a) TRps = (Dt + (PE - PB)) / PB where Dt = the preferred dividend PE = ending price or sale price PB = beginning price or purchase price TR = (5 + -7) / 70 = -2.86% (b) TRw = (Ct + PC) / PB where Ct is any cash payments paid (there are none for a warrant) PC = price change during the period TR = (0 + 2)/11 = 18.18% for the three month period (c) TRb = (It + PC) / PB = (240* + 60) / 870 = 34.5% for the two year period. *interest received is $120 per year (12% of $1000) for two years, or $240. Calculating Return Relatives (RRs) for these examples: (a) a TR of -2.86% is equal to a RR of .9714 or (1.0+ [-.0286]) (b) a TR of 18.18% is equal to a RR of 1.1818 (c) a TR of 34.5% is equal to a RR of 1.345 6-2. Returns for the S&P 500 for 2000-2002 are -9.05%, -11.85%, and -22.10%. For 2003 the return was 28.37%. The arithmetic mean for 2000-2002 was -14.33; the geometric mean, -14.52%. The arithmetic mean for 2000-2003 was -3.6575; the geometric mean, -5.38%. 6-3. $100(1.3148)(.95153)(1.20367)(1.22312)(1.05966)(1.31057)(1.18539)(1.05665) (1.16339) (1.31229) = 4.89140 = the cumulative wealth index for this period. (4.89140)1/10 = 1.17204 1.17204 - 1.0 = .17204 or 17.204% Chapter 7 7-1. Historical returns are realized returns, or ex-post returns, such as those reported by Ibbotson Associates and Wilson and Jones in Chapter 6 (Table 6-6). Expected returns are ex ante returns--they are the most likely returns for the future, although they may not actually be realized because of risk. 7-2. The expected return for one security is determined from a probability distribution consisting of the likely outcomes, and their associated probabilities, for the security. The expected return for a portfolio is calculated as a weighted average of the individual securities’ expected returns. The weights used are the percentages of total investable funds invested in each security. 7-3. The Markowitz model is based on the calculations for the expected return and risk of a portfolio. Another name associated with expected return is simply “mean,” and another name associated with the risk of a portfolio is the “variance.” Hence, the model is sometimes referred to as the mean-variance approach. 7-4. The expected return for a portfolio of 500 securities is calculated exactly as the expected return for a portfolio of 2 securities--namely, as a weighted average of the individual security returns. With 500 securities, the weights for each of the securities would be very small. 7-5. Each security in a portfolio, in terms of dollar amounts invested, is a percentage of the total dollar amount invested in the portfolio. This percentage is a weight, and the general assumption is that these weights sum to 1.0, accounting for all of the portfolio funds. 7-1. (.15)(.20) = .030 (.20)(.16) = .032 (.40)(.12) = .048 (.10)(.05) = .005 (.15)(-.05) = -.0075 .1075 or 10.75% = expected return To calculate the standard deviation, use the formula n VARi = Σ [PRi-ERi]2Pi i=1 VARGF = [(.20-.1075)2.15] + [(.16-.1075)2.20] + [(.12-.1075)2.40] + [(.05-.1075)2.10] + [(-.05-.1075)2.15] = .00128 + .00055 + .00006 + .00033 + .00372 = .00594 Since σi = (VAR)1/2 the σ for GF = (.00594)1/2 = .0771 = 7.71% 7-2. (a) (.25)(15) + (.25)(12) + (.25)(30) + (.25)(22) = 19.75% (b) (.10)(15) + (.30)(12) + (.30)(30) + (.30)(22) = 20.70% (c) (.10)(15) + (.10)(12) + (.40)(30) + (.40)(22) = 23.50%


