jbi12694-sup-0001-AppendixS1
advertisement
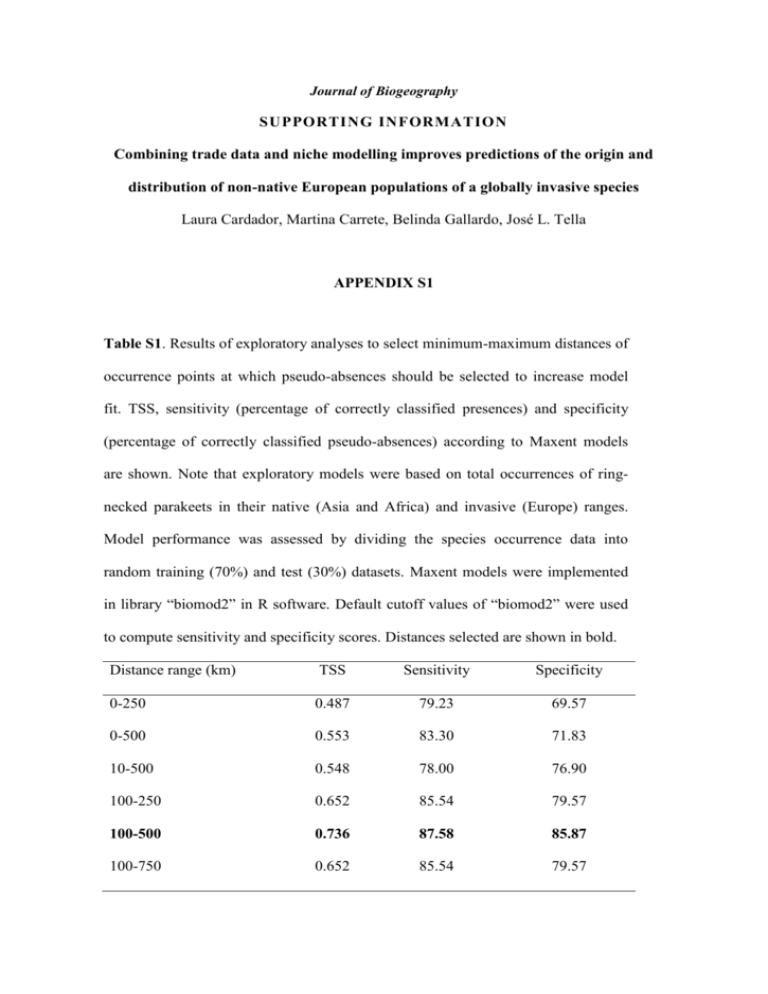
Journal of Biogeography SUPPORTING INFORMATION Combining trade data and niche modelling improves predictions of the origin and distribution of non-native European populations of a globally invasive species Laura Cardador, Martina Carrete, Belinda Gallardo, José L. Tella APPENDIX S1 Table S1. Results of exploratory analyses to select minimum-maximum distances of occurrence points at which pseudo-absences should be selected to increase model fit. TSS, sensitivity (percentage of correctly classified presences) and specificity (percentage of correctly classified pseudo-absences) according to Maxent models are shown. Note that exploratory models were based on total occurrences of ringnecked parakeets in their native (Asia and Africa) and invasive (Europe) ranges. Model performance was assessed by dividing the species occurrence data into random training (70%) and test (30%) datasets. Maxent models were implemented in library “biomod2” in R software. Default cutoff values of “biomod2” were used to compute sensitivity and specificity scores. Distances selected are shown in bold. Distance range (km) TSS Sensitivity Specificity 0-250 0.487 79.23 69.57 0-500 0.553 83.30 71.83 10-500 0.548 78.00 76.90 100-250 0.652 85.54 79.57 100-500 0.736 87.58 85.87 100-750 0.652 85.54 79.57 Table S2. Characteristics of occurrence localities of the ring-necked parakeet in Africa, Asia and Europe. Means and ranges (in parenthesis) of annual mean temperature (TMEAN), temperature seasonality (TRANGE, standard deviation *100), maximum temperature of the warmest month (TMAX), minimum temperature of the coldest month (TMIN), annual precipitation (PAN), precipitation of the driest month (PMIN), precipitation seasonality (PRANGE, coefficient of variation), altitude (ALT) and population density (POP) are provided. Percentage of occurrences in different land-use types is also provided. Sample size: 140 for Africa, 1 070 for Asia and 535 for Europe. Variable Africa Asia Europe TMEAN (°C) 26.9 (14.3 - 29.7) 25.2 (-2.4 - 29.1) 11.8 (5-20.0) TMAX (°C) 36.8 (7.2 - 42.4) 36.3 (11.9 - 43.0) 24.5 (17.3 - 38.7) TMIN (°C) 16.3 (5.7 - 22.7) 13.3 (-17.7 - 23.4) 1.5 (-9.0 - 13.8) TRANGE (°C) 191 (57 - 363) 359 (51 - 764) 530 (229 - 913) PMEAN (mm) 859 (72 - 3,768) 1,388 (125 - 4,588) 682 (109 - 1,478) 3 (0 - 66) 8 (0 - 162) 33 (0 - 97) PRANGE (mm) 122 (34 - 184) 108 (29 -163) 28 (8 - 100) ALT (m) 223 (3 - 2,623) 382 (0 - 5,033) 157 (0 - 2,267) 864 (0 - 30,379) 918 (0 - 36,732) 758 (0 - 20,846) PMIN (mm) POP (number of people) Land-use type (%) Woodlands 34.9 31.4 14.4 Open lands 25.6 3.1 3.2 Crop lands 21.7 55.9 42.3 Urban 10.9 8.6 38.9 Others 7.0 1.1 1.2 Figure S1. Distribution of the ring-necked parakeet in the study area. Occurrences according to (a) information used in this study (http://ebird.org/content/ebird/) and GBIF (http://data.gbif.org) based on eBird datasets, (b) CABI (http://www.cabi.org/), (c) DAISIE (http://www.europe-aliens.org/) and (d) countries where the species has been recorded according to ISSG (http://www.issg.org/database). In grey, the native and invasive areas considered in this study; in red, occurrences or countries classified as invasive; in blue, occurrences or countries classified as native. In yellow data not classified as native/invasive or not used in this study. Figure S2. Binary predictions of suitable habitat in Europe for the ring-necked parakeet according to models calibrated in African and Asian ranges. Results of models based on different techniques are shown: generalized additive models (GAM), generalized linear models (GLM) and random forest (RF). Figure S3. Deviance explained by pure and joint effects of environmental suitability, propagule pressure and geographic origin, obtained from generalized linear models (GLM) for occurrence rate of ring-necked parakeets in 25 European countries. Results of deviance partitioning for GLMs without (a) and with (b) year of first importation as control variable are shown.

