Definitions
advertisement
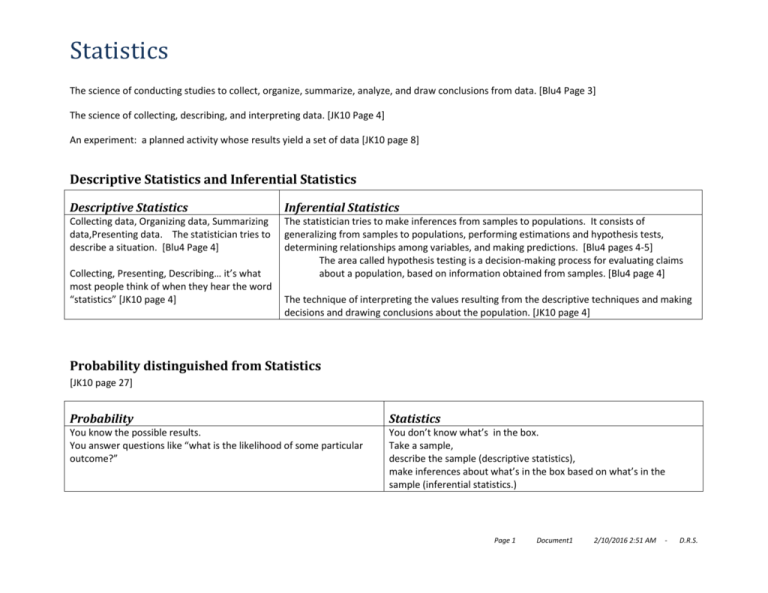
Statistics The science of conducting studies to collect, organize, summarize, analyze, and draw conclusions from data. [Blu4 Page 3] The science of collecting, describing, and interpreting data. [JK10 Page 4] An experiment: a planned activity whose results yield a set of data [JK10 page 8] Descriptive Statistics and Inferential Statistics Descriptive Statistics Inferential Statistics Collecting data, Organizing data, Summarizing data,Presenting data. The statistician tries to describe a situation. [Blu4 Page 4] The statistician tries to make inferences from samples to populations. It consists of generalizing from samples to populations, performing estimations and hypothesis tests, determining relationships among variables, and making predictions. [Blu4 pages 4-5] The area called hypothesis testing is a decision-making process for evaluating claims about a population, based on information obtained from samples. [Blu4 page 4] Collecting, Presenting, Describing… it’s what most people think of when they hear the word “statistics” [JK10 page 4] The technique of interpreting the values resulting from the descriptive techniques and making decisions and drawing conclusions about the population. [JK10 page 4] Probability distinguished from Statistics [JK10 page 27] Probability Statistics You know the possible results. You answer questions like “what is the likelihood of some particular outcome?” You don’t know what’s in the box. Take a sample, describe the sample (descriptive statistics), make inferences about what’s in the box based on what’s in the sample (inferential statistics.) Page 1 Document1 2/10/2016 2:51 AM - D.R.S. Populations and Samples A Population A Sample A population consists of all subjects (human or otherwise) that are being studied. [Blu4 page 4] A sample is a group of subjects selected from a population. [Blu4 page 4] A collection, or set, of individuals, objects, or events whose properties are to be analyzed. [JK10 page 7] A sample is a subset of a population [JK10 page 8] A sample survey rather than a census [JK10 page 20] A census [JK10 page 20] A Parameter A parameter is a numerical value summarizing all of the data of an entire population [JK10 page 8] A Statistic A statistic is a numerical value summarizing the sample data. [JK10 page 8] Page 2 Document1 2/10/2016 2:51 AM - D.R.S. Variables and Data Variable (n) Data Random Variables Data Set Data value, or Datum A characteristic or attribute that can assume different values [Blu4 page 3] The values (measurements or observations) that the variables can assume. [Blu4 page 3] Variables whose values are determined by chance [Blu4 Page 3] A collection of data values [Blu4 page 4] Each value in a data set is called a data value, or datum. [Blu4 page 4] A characteristic of interest about each individual element of a population or sample [JK10 page 8] The set of values collected from the variable from each of the elements that belong to the sample. [JK10 page 8] The value of the variable associated with one element of a population or a sample. This value may be a number, a word, or a symbol. [JK10 page 8] Qualitative Variables and Quantitative Variables Qualitative Variables Quantitative Variables Variables that can be placed into distinct categories, according to some characteristic or attribute. Examples: M/F, religious preference, geographic location. [Blu4 page 6] Numerical values. They can be ordered or ranked. Examples: age, weight, temperature. [Blu4 page 6] A variable that “quantifies” an element of a population. [JK10 page 10] A variable that describes or categorizes an element of a population. Synonyms: “attribute”, “categorical variable” [JK10 page 9] Discrete variables Countable. Examples: How many children in a family, how many phone calls received. [Blu4 page 6] Continuous variables Can assume an infinite number of “between” values. Measurements. Including fractions and decimals [Blu4 page 6] Can assume a countable number of values. Isolated points along a line interval. There are gaps between possible values. [JK10 page 11] “15” means “14.5-15.5” which means “14.5 ≤ 𝑥 < 15”. [Blu4 page 7] Can assume an uncountable number of values. Any value along a line interval, including every possible value between any two values. Page 3 Document1 2/10/2016 2:51 AM - D.R.S. Measurement Scales: Nominal, Ordinal, Interval, Ratio Nominal level of measurement Ordinal level of measurement Interval level of measurement Ratio level of measurement Classifies data into mutually exclusive (non-overlapping) exhausting categories in which no order or ranking can be imposed on the data. Examples: zip code, political party, marital status [Blu4 pages 7-8] Classifies data into categories that can be ranked; however, precise differences between the ranks do not exist. Examples: A,B,C,D,F; small, medium, large. [Blu4 page 8] Ranks data, and precise differences between units of measure do exist; however, there is no meaningful zero. Examples: IQ scores, temperature measurements. [Blu4 page 8] Interval measurement and there’s a concept of a true zero. And true ratios exist when the same variable is measured on two different members of the population. Examples: height, weight, area, count of some event. [Blu4 page 8] Characterizes/ Describes / Names an element of a population. Arithmetic operations are not meaningful on nominal variables. There is no sense of higher or lower. [JK10 page 10, modified] A qualitative variable that incorporates an ordered position, or ranking. [JK10 page 10] These are examples of qualitative variables. These are examples of quantitative variables. Page 4 Document1 2/10/2016 2:51 AM - D.R.S. Kinds of surveys Kind of surveys [Blu4 pages 9-10] Advantages Disadvantages Telephone surveys Mailed questionnaire surveys Personal interview surveys Less costly than personal interview. Maybe more candid responses. Wider geographic area can be covered. Less expensive. Anonymity of respondents. Low response rate. Inappropriate answers. Some may find questions difficult or hard to understand. Can obtain in-depth responses. Miss the phoneless, no answers. Unlisted numbers. Cell numbers. Tone of voice can influence response. Interviews must be trained. Costly. Other data collection methods [Blu4 page 10] Surveying records Direct observation Page 5 Document1 2/10/2016 2:51 AM - D.R.S. Sampling methods A sampling frame is a list, or set, of the elements belonging to the population from which the sample will be drawn. Ideally, the sampling frame should be identical to the population with every element of the population included once and only once. [JK10 page 20] Random Sampling Using chance methods or random numbers [Blu4 page 11] Systematic sampling th Select every k subject [Blu4 page 12] …starting from a first element, which is randomly selected from the first k elements. [JK10 page 23] Cluster sampling Convenience sampling Divide population into groups. Select some groups to be in the sample. [Blu4 page 12] Whoever’s available [Blu4 page 13] Stratified sampling Divide population into groups (“strata”) and sample some from each group. [Blu4 page 12] ..and then selecting a number of items from each of the strata by means of a simple random sampling technique.” [JK10 page 24] Volunteer sampling …stratifying the population… and then selecting some or all of the items from some, but not all, of the strata. [JK10 page 25] Biased sampling method: A sampling method that produces data that systematically differ from the sampled population. [JK10 page 18] Judgment samples: Samples that are selected on the basis of being judged “typical”. [JK10 page 21] Probability samples: Sames in which the elements to be selected are drawn on the basis of probability. Each element in a population has a certain probability of being selected as part of the same.[ JK10 page 21] Excellent tree diagram of sampling techniques on [JK10 page 21]. Definitions follow for “single-stage sampling”, “simple random sample”, “multistage random sampling”, “proportional stratified sample” Page 6 Document1 2/10/2016 2:51 AM - D.R.S. The data collection process [JK10 Page 19] 1. 2. 3. 4. 5. Define the objectives of the survey or study. Define the variable and the population of interest. Define the data collection and the data measuring schemes. Collect your sample. Select the subjects to be sampled and collect the data. Review of the sampling process upon completion of collection. Page 7 Document1 2/10/2016 2:51 AM - D.R.S. Kinds of studies Observational study Experimental study The researcher observes what is happening or what has happened in the past and tries to draw conclusions based on these observations. [Blu4 page 14] The researcher manipulates one of the variables and tries to determine how the manipulation influences other variables. [Blu4 page 14] Independent Variable Dependent Variable (also known as the Explanatory variable) (also known as the outcome variable) The variable that is being manipulated by the The resultant variable. [Blu4 page 14] researcher. [Blu4 page 14] A confounding variable is one that influences the dependent or outcome variable but cannot be separated from the independent variable. The Hawthorne Effect is when subjects who are aware that they are subjects in an experiment change their behavior in ways that affect the results of the study. Advantages and disadvantages – discussion on [Blu4 pages 14-15] Page 8 Document1 2/10/2016 2:51 AM - D.R.S. Misuses and Abuses of Statistics [Blu4 pages 16-18] Suspect Samples Ambiguous Averages Changing the Subject Detached statistics Implied connections Misleading graphs Faulty survey questions Was the sample size too small? Were the subjects selected properly, without bias? Is the sample representative of the population? Choosing the one statistic to support a particular position and ignoring the rest Talking about measurements or talking about percentages. And if talking about percentages, percent of what? Changing the timeframe [my addition] No comparison is present Hedging: “may help”, “studies suggest”, “in some people” (details discussed elsewhere) It’s all in the wording. Page 9 Document1 2/10/2016 2:51 AM - D.R.S.
