Antifungal Effect Of Lactobacilli lactis On Candida albicans Yeast
advertisement
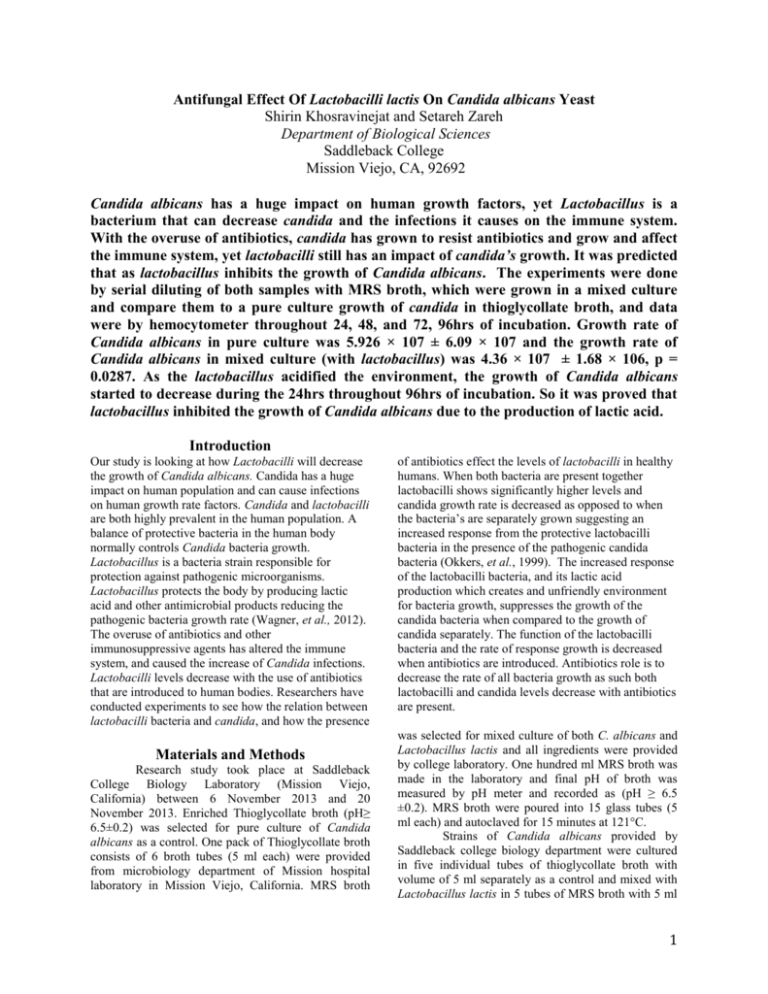
Antifungal Effect Of Lactobacilli lactis On Candida albicans Yeast Shirin Khosravinejat and Setareh Zareh Department of Biological Sciences Saddleback College Mission Viejo, CA, 92692 Candida albicans has a huge impact on human growth factors, yet Lactobacillus is a bacterium that can decrease candida and the infections it causes on the immune system. With the overuse of antibiotics, candida has grown to resist antibiotics and grow and affect the immune system, yet lactobacilli still has an impact of candida’s growth. It was predicted that as lactobacillus inhibits the growth of Candida albicans. The experiments were done by serial diluting of both samples with MRS broth, which were grown in a mixed culture and compare them to a pure culture growth of candida in thioglycollate broth, and data were by hemocytometer throughout 24, 48, and 72, 96hrs of incubation. Growth rate of Candida albicans in pure culture was 5.926 × 10⁷ ± 6.09 × 10⁷ and the growth rate of Candida albicans in mixed culture (with lactobacillus) was 4.36 × 10⁷ ± 1.68 × 10⁶, p = 0.0287. As the lactobacillus acidified the environment, the growth of Candida albicans started to decrease during the 24hrs throughout 96hrs of incubation. So it was proved that lactobacillus inhibited the growth of Candida albicans due to the production of lactic acid. Introduction Our study is looking at how Lactobacilli will decrease the growth of Candida albicans. Candida has a huge impact on human population and can cause infections on human growth rate factors. Candida and lactobacilli are both highly prevalent in the human population. A balance of protective bacteria in the human body normally controls Candida bacteria growth. Lactobacillus is a bacteria strain responsible for protection against pathogenic microorganisms. Lactobacillus protects the body by producing lactic acid and other antimicrobial products reducing the pathogenic bacteria growth rate (Wagner, et al., 2012). The overuse of antibiotics and other immunosuppressive agents has altered the immune system, and caused the increase of Candida infections. Lactobacilli levels decrease with the use of antibiotics that are introduced to human bodies. Researchers have conducted experiments to see how the relation between lactobacilli bacteria and candida, and how the presence Materials and Methods Research study took place at Saddleback College Biology Laboratory (Mission Viejo, California) between 6 November 2013 and 20 November 2013. Enriched Thioglycollate broth (pH≥ 6.5±0.2) was selected for pure culture of Candida albicans as a control. One pack of Thioglycollate broth consists of 6 broth tubes (5 ml each) were provided from microbiology department of Mission hospital laboratory in Mission Viejo, California. MRS broth of antibiotics effect the levels of lactobacilli in healthy humans. When both bacteria are present together lactobacilli shows significantly higher levels and candida growth rate is decreased as opposed to when the bacteria’s are separately grown suggesting an increased response from the protective lactobacilli bacteria in the presence of the pathogenic candida bacteria (Okkers, et al., 1999). The increased response of the lactobacilli bacteria, and its lactic acid production which creates and unfriendly environment for bacteria growth, suppresses the growth of the candida bacteria when compared to the growth of candida separately. The function of the lactobacilli bacteria and the rate of response growth is decreased when antibiotics are introduced. Antibiotics role is to decrease the rate of all bacteria growth as such both lactobacilli and candida levels decrease with antibiotics are present. was selected for mixed culture of both C. albicans and Lactobacillus lactis and all ingredients were provided by college laboratory. One hundred ml MRS broth was made in the laboratory and final pH of broth was measured by pH meter and recorded as (pH ≥ 6.5 ±0.2). MRS broth were poured into 15 glass tubes (5 ml each) and autoclaved for 15 minutes at 121°C. Strains of Candida albicans provided by Saddleback college biology department were cultured in five individual tubes of thioglycollate broth with volume of 5 ml separately as a control and mixed with Lactobacillus lactis in 5 tubes of MRS broth with 5 ml 1 volume and incubated 24 hours at 37°C. Grown colonies in pure and mixed cultures were observed under light microscope with 400× magnification to distinguish between Lactobacillus and Candida strains. Ability of the pro biotic bacteria to inhibit growth of C. albicans was evaluated using a culture overlay technique in which pure and mixed culture were separately diluted to 107 µl in five sets of samples into seven micro centrifuge tubes labeled from 101 to 107. Using aseptic technique and 1000 µl micropipette (P1000) with volume set to 900 µl, 900µl of MRS broth were pipette into each 35 micro centrifuge tubes for 5 sets of mixed culture (n=5). Using 200 µl micropipette (P200) with volume set to 100 µl, 100 µl of first mixed culture broth of Lactobacillus and Candida were added to 101 micro centrifuge tubes for set number one and were mixed by vortex (VWR Scientific Products) mixer accordingly. One hundred µl of tube 101 were removed and transferred into 102 micro centrifuge tubes and serial dilution were completed to 107 then procedure was repeated for four remaining sets and total number of 35 micro centrifuge tubes consist of diluted mixed Lactobacillus and C. albicans obtained. Five sets of thioglycollate broth consist of pure C. albicans were also Diluted using same technique and total number of 35 diluted tubes of pure C. albicans obtained. All 70 pure and mixed diluted micro centrifuge tubes then incubated for 24 hours at 37°C. From serial diluted micro centrifuge tubes, five sets of tubes with suspension 107 were selected for the pure and mixed cultures to be counted using hemocytometer at 24, 48, 72 and 96 hours of incubation. To prepare the hemocytometer, the mirrorlike polished surface was cleaned with lens paper and 95% ethanol and a coverslip placed on the grids prior to adding cell suspension. Cell suspension was mixed 10 sec by vortex and 20 µl of sample drawn and introduced into one of the V-shaped grids under coverslip. The counting chamber was then placed under microscope with magnification set to 100× and five squares out of nine large squares (four outer squares and one central square) were selected for count. Cells that overlapped a ruling counted in if they overlapped the top or right ruling and out if they overlapped bottom or left ruling. Candida cells counted for 24, 48, 72 and 96 hours of incubation and data recorded accordingly. Knowing that each large square of hemocytometer represented a total volume of 0.1 mm³ or 10-4 cm³. Since 1cm³ is equivalent to 1 ml, the total number of cell per 1ml was determined using the following calculations: Dilution Factor= Volume of sample = 1000𝜇l = 10 Volume of cells 100 𝜇l Total number of cells/ml = total number of cells counted in all × Dilution factor × 104 cells/cm³ 5 squares number of squares Total numbers of cells per 5ml of original samples for each five original tubes of pure and mixed culture were also calculated using following formula: Total number of cells/5ml sample = Total number of cells per 1ml × 5 Total number of cells per 5 ml of five original samples were added and divided by five to get the average of five initial samples for both pure and mixed cultures. A pH control test was run on mixed and pure broth to confirm the decrease in pH by production of lactic acid, which inhibited growth of C. albicans. Calculated data for Candida pure culture and mixed culture at 24, 48, 72 and 96 hours were analyzed on MS Excel (Microsoft Corporation Redmond Washington) using unpaired t-test for growth of candida in pure and mixed cultures and ANOVA and Bonferroni corrections for difference in growth at 24, 48, 72and 96 hours of incubation. Results Candida albicans cells counted in thioglycollate broth for five sets of pure samples and in MRS broth for five sets of mixed samples at 24, 48, 72 and 96 hours of incubation and data recorded are shown in table1. Total numbers of cells per 1ml calculated for five tubes in both pure and mixed culture and the results are shown in table2. Total numbers of cells/5ml of original samples were also calculated and average number of C.albicans cells obtained from five sets of tubes for both cultures and shown in table3 and 4. Data analyzed using one tailed unpaired t-test and mean graphs of typical growth are shown in figure1. There was a consistent marked decrease in Candida when grown with lactobacilli. All five tubes of mixed culture of Candida and Lactobacillus showed this decrease, however not in a same ratio. P value = 0.00235276 supported the hypothesis of the study that Lactobacilli cause a significant decrease in growth of Candida albicans. Hours of incubati on # Of Candida counted in 5 squares in pure micro tube with suspention10⁷ Tube2 24 Tube 1 530 Tube 4 1340 Tube 5 347 Tube 3 940 48 477 265 711 955 789 1012 2 72 397 228 681 890 533 96 273 128 550 761 432 in 5 squares in 24 # of Candida Counted mixed micro tube 10⁷ Tube Tube Tube 1 2 3 102 53 167 Tube 4 425 Tube 5 188 48 54 27 77 120 102 72 40 11 40 65 22 96 28 7 25 21 15 4 10 5 10 5 1.0 0E +0 4 1.0 0E +0 4 8.00 E+0 5 2.20 E+0 5 8.00 E+0 5 1.30 E+0 6 4.40 E+0 5 5.60 E+0 5 1.40 E+0 5 5.00 E+0 5 4.20 E+0 5 3.00 E+0 5 Table 2. Total number of Candida cells calculated per 1ml at 24, 48, 72, 96 hours of incubation. Total # of Candida per 5 ml of sample Table 1. Number of Candida cells counted in all five squares of hemocytometer at 24, 48, 72, 96 hours of incubation. Dilu tion fact or 10 # Of squ ares 5 10 5 10 5 10 5 Dilu tion fact or # of squ ares 10 5 10 5 Sus pen sio n 1.0 0E +0 4 1.0 0E +0 4 1.0 0E +0 4 1.0 0E +0 4 Sus pen sio n 1.0 0E +0 4 1.0 0E +0 Total # of Candida cells per ml Tub e1 1.06 E+0 7 Tub e2 6.94 E+0 6 Tub e3 1.88 E+0 7 Tub e4 2.68 E+0 7 Tub e5 2.02 E+0 7 9.54 E+0 6 5.30 E+0 6 1.42 E+0 7 1.91 E+0 7 1.58 E+0 7 7.94 E+0 6 4.56 E+0 6 1.36 E+0 7 1.78 E+0 7 1.07 E+0 7 5.46 E+0 6 2.56 E+0 6 1.10 E+0 7 1.52 E+0 7 8.64 E+0 6 Total # of Candida cells per ml Tube 1 Tube 2 Tube3 Tube 4 Tube 5 5.30E+0 7 4.77E+0 7 3.97E+0 7 2.73E+0 7 3.47E+0 7 2.65E+0 7 2.28E+0 7 1.28E+0 7 9.40E+0 7 7.11E+0 7 6.81E+0 7 5.50E+0 7 1.34E+0 8 9.55E+0 7 8.90E+0 7 7.61E+0 7 1.01E+ 08 7.89E+ 07 5.33E+ 07 4.32E+ 07 Total # of Candida per 5 ml of sample Tube 1 Tube 2 Tube3 Tube 4 Tube 5 1.02E+0 7 5.40E+0 6 4.00E+0 6 2.80E+0 6 5.30E+0 6 2.70E+0 6 1.10E+0 6 7.00E+0 5 1.67E+0 7 7.70E+0 6 4.00E+0 6 2.50E+0 6 4.25E+0 7 1.20E+0 7 6.50E+0 6 2.10E+0 6 1.88E+ 07 1.02E+ 07 2.20E+ 06 1.50E+ 06 Table 3. Total number of Candida cells calculated per 5ml of original samples at 24, 48, 72, 96 hours of incubation. Total # of Candida per 5ml of average 5 initial pure cultures 8.34E+07 6.39E+07 Tub e1 2.04 E+0 6 Tub e2 1.06 E+0 6 Tub e3 3.34 E+0 6 Tub e4 8.50 E+0 6 Tub e5 3.76 E+0 6 1.08 E+0 6 5.40 E+0 5 1.54 E+0 6 2.40 E+0 6 2.04 E+0 6 5.46E+07 4.29E+07 Total # of Candida per 5ml of average 5 initial mixed cultures 1.87E+07 7.60E+06 3.56E+06 3 1.92E+06 Mean Variance Observations Hypothesized Mean Difference df t Stat P(T<=t) one-tail Variable 2 50000000 7945000 40000000 5.71E+13 4 30000000 0 4 5.69205571 0.00235276 20000000 2.13184679 0.00470552 t Critical two-tail 2.77644511 10000000 0 5.00E+07 4.00E+07 3.00E+07 Cells/5ml of sample 6.00E+07 2.00E+07 1.00E+07 0.00E+00 0 24 48 72 Pure Candida Culture 1 Mixed culture with… Figure 2. Mean number of Candida cells per 5ml of samples in Pure and Mixed culture with Lactobacilli. There is a significant decrease in Candida growth when mixed with Lactobacilli (P= 0.028767, One tailed unpaired t-test). Error bars are mean ± SEM. Using ANOVA and Bonferroni corrections typical growth of Candida in both pure and mixed cultures analyzed and results indicated that as incubation hours increased Growth in all five pure samples and all five Pure mixed samples followed the same pattern such that cultur cells growth significantly increased during the first 24 hours of incubation in both cultures. As incubation e continued to 48 hours growth dropped significantly and continued dropping during 72 and 96 hours of incubation however not as quick as 48 hours. Growth curve is shown in figure 1. Mixed P value=0.000112 indicates that growth rate of cultur Candida is significantly different from 24 through 96 hours of incubations. e ANOVA: two-factor without replication 9.00E+07 7.00E+07 60000000 Variable 1 61195000 2.9297E+14 4 t Critical one-tail P(T<=t) two-tail 8.00E+07 70000000 Cells/5ml of sample Table 4. Average number of Candida cells calculated per 5ml of original samples at 24, 48, 72, 96 hours of incubation. T-test: two-sample assuming unequal variances 96 Hours of incubation Figure 1. Average Number of Candida albicans cells per 5ml of pure culture and mixed culture with Lactobacilli vs. hours of incubation. There is a significant statistical Difference in growth of candida cells throughout the hours of incubation (P=1.12×10 -4, Anova & Bonferroni correction). Summary Row 1 Count 4 Row 2 4 Row 3 4 Column 1 3 Column 2 3 Column3 3 Column 4 3 Sum 240 2.448E+ 11 3.178E+ 10 1.021E+ 11 7.15E+ 10 5.816E+ 10 4.48E+ 10 Average 60 6.12E + 11 7.945E + 09 3.40E + 10 2.38E + 10 1.94E + 10 1.49E + 10 Variance 960 2.9286E +20 5.7106E +19 1.91522E +21 1.21844E +21 9.33153E +20 5.87E+ 20 4 Discussion ANOVA: Source of variation SS df MS F P-value F Crit Rows Columns 8.86E+21 6.01E+20 2 3 4.43E+21 2.00E+20 59.2506 2.680985 1.12E-04 1.40E-01 5.143253 4.757063 It was noted that throughout the incubation, cultures containing Lactobacilli were more strongly acidic (pH=5.0-4.0) than pure cultures of the yeasts (pH=6.57.0). This suggested the possibility that the decrease in C. albicans in mixed culture with Lactobacilli is due to lactic acid accumulation by Lactobacilli, which inhibits growth of yeast significantly. To determine the specificity of the effect, pH determined after 24, 48, 72 and 96 hours of incubation and results are shown in figure3. 8 7 6 Pure Candida Culture pH 5 4 3 Mixed culture with Lacrobaci li 2 1 0 0 24 48 72 96 Hours of incubation Figure 3. pH of mixed MRS broth consist of both yeast and Lactobacilli and pure thioglycollate broth of Candida Vs. hours of incubation. Cultures containing Lactobacilli are more acidic than pure Candida culture due to lactic acid production by Lactobacilli. Lactobacillus decreases the growth rate of Candida albicans yeast by acidifying the environment. Lactobacillus is a bacterium that produces lactic acid in its environment so that it will inhibit the growth of harmful bacteria. Because of lactic acid being the byproduct of lactobacillus it stabilizes the pH of the vagina, which prevents growth of Candida albicans (Jeavons, 2003). Candida albicans is a yeast, which grows in mouth and vagina of humans and infects its location. Candida is a fungus that feeds on carbohydrates and protein such as glucose in order to grow and produce. When candida starts growing in the vagina, it will produce mycelia form of hyphae on the lining of the skin. As it feeds on carbohydrates its will start to grow and move towards the intestines. When grown, it will build up a biofilm throughout the body from the vagina to the intestines. To break down and kill the Candida a colon-cleansing product will get produced in the intestines to acidify the environment and deprotonate Candida albicans (copyright, 2012). As said before, candida cannot grow in an acidic environment; its growth factors will be affected. Moreover, when the bacteria and the yeast are grown in the same environment, the bacteria (lactobacillus) will pre-dominate over the yeast (Candida albicans). In this study we looked at two environments of pure candida and mixed candida with lactobacilli. The factors that were measured in the 24, 48, 72, and 96hrs were the pH, the amount of yeast growth in both cultures. As predicted the growth of candida will decrease in the presence of lactobacillus. As the results show, there was a decrease in the growth of candida in the mixed culture because of the presence of lactobacilli. The more lactobacilli was added to the environment the more it effected the growth factors of candida. The reason is because lactobacillus will produce lactic acid, which will drop the pH of the environment and will be acidic. Acknowledgement We would like to have a special thanks to professor Teh and the Department of biological science at Saddleback College for helping and supporting us throughout our study. Literature Citation Cartwright, Peter. "Can Probiotics Reduce Candida Infections?." The Clinical Use of Probiotics. Ed Barlow J. Probiotics International Ltd, United Kingdom. - (2010): 21-24. Jeavons, H. S. 2003. Prevention and Treatment of 5 Vulvovaginal Candidiasis Using Exogenous Lactobacillus. Journal of Obstetric, Gynecologic and Neonatal Nursing 32(3): 287-296. KARÄ°PTAÅž, Ergin , Åžener TULUMOÄžLU, and Belgin ERDEM. "Antifungal Effects of Lactobacillus spp. Bacteria on Candida Yeast." Kafkas Univ Vet Fak Derg 16 (2010): 1061-1064. Okkers, D.J. , L.M.T. Dicks, M. Silvester, J.J. Joubert, and H.J. Odendaal. "Characterization of pentocin TV35b, a bacteriocin-like peptide isolated from Lactobacillus pentosus with a fungistatic effect on Candida albicans." Journal of Applied Microbiology 87 (1999): 726-734. Young, Genevieve, R. I. Krasner, and P. L. Yudkofsky. "INTERACTIONS OF ORAL STRAINS OF CANDIDA ALBICANS AND LACTOBACILLI." Journal of Bacteriology 74 (1956): 525–529. Young, G., Resca, H.G., and Sullivan, M.T. 1951 “The Yeasts Of The Normal Mouth and Their Relation To Salivary Acidity.” J. Dental Research, 30, 426-430 6

