Practical Exam #4 (Show all work)
advertisement
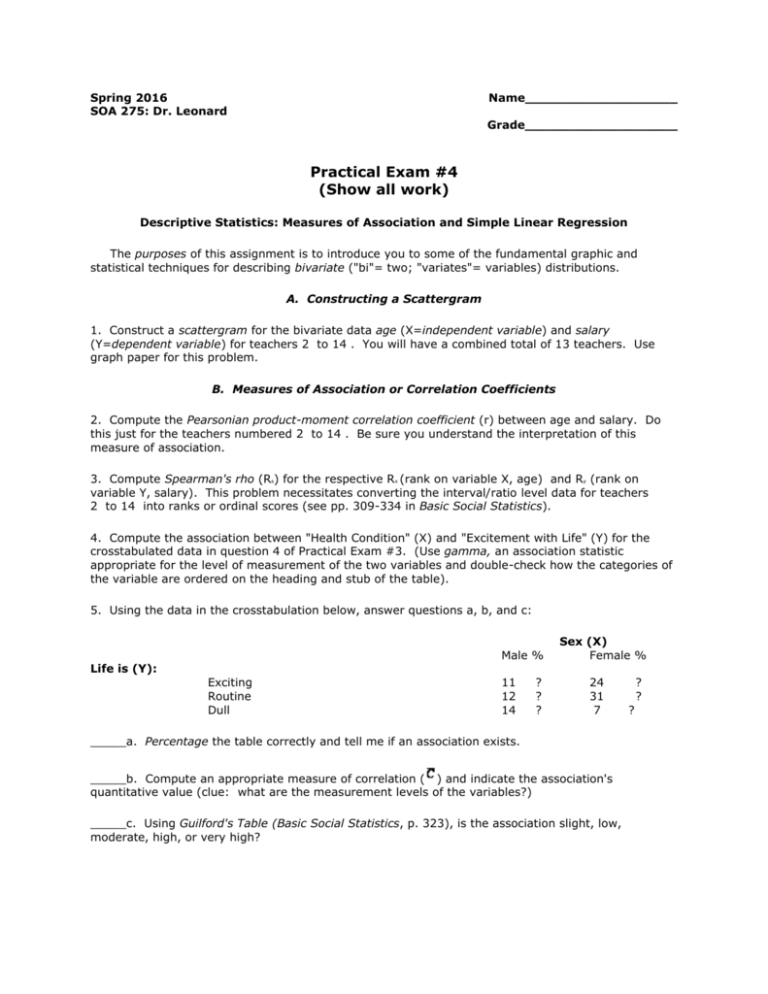
Spring 2016 SOA 275: Dr. Leonard Name___________________ Grade___________________ Practical Exam #4 (Show all work) Descriptive Statistics: Measures of Association and Simple Linear Regression The purposes of this assignment is to introduce you to some of the fundamental graphic and statistical techniques for describing bivariate ("bi"= two; "variates"= variables) distributions. A. Constructing a Scattergram 1. Construct a scattergram for the bivariate data age (X=independent variable) and salary (Y=dependent variable) for teachers 2 to 14 . You will have a combined total of 13 teachers. Use graph paper for this problem. B. Measures of Association or Correlation Coefficients 2. Compute the Pearsonian product-moment correlation coefficient (r) between age and salary. Do this just for the teachers numbered 2 to 14 . Be sure you understand the interpretation of this measure of association. 3. Compute Spearman's rho (Rs) for the respective Rx (rank on variable X, age) and Ry (rank on variable Y, salary). This problem necessitates converting the interval/ratio level data for teachers 2 to 14 into ranks or ordinal scores (see pp. 309-334 in Basic Social Statistics). 4. Compute the association between "Health Condition" (X) and "Excitement with Life" (Y) for the crosstabulated data in question 4 of Practical Exam #3. (Use gamma, an association statistic appropriate for the level of measurement of the two variables and double-check how the categories of the variable are ordered on the heading and stub of the table). 5. Using the data in the crosstabulation below, answer questions a, b, and c: Male % Sex (X) Female % Life is (Y): Exciting Routine Dull 11 12 14 ? ? ? 24 31 7 _____a. Percentage the table correctly and tell me if an association exists. _____b. Compute an appropriate measure of correlation ( ) and indicate the association's quantitative value (clue: what are the measurement levels of the variables?) _____c. Using Guilford's Table (Basic Social Statistics, p. 323), is the association slight, low, moderate, high, or very high? ? ? ? C. Computing a Regression Equation 6. Compute the regression equation using salary (Y) as the dependent variable and age (X) as the independent variable for the same teachers as used in questions #1 and #2 of this practical exam. Write it out, plot it on the scattergram and make a prediction for Teachers 3 and 29, i.e., use the X values (age) to predict the Y values (salary). a. The difference between the actual value and the predicted value is called aresidual. If residuals for all states were determined and squared a statistical quantity called the residual sum of squares or sum of squared errors (abbreviated "SSE") would be obtained. This quantity is useful for understanding the proportional reduction in error ("PRE") interpretation of Pearson's r. NOTE: These statistics are among the most commonly used ones for assessing the nature of bivariate distributions. As such they are used as measures of association. Be sure you understand the general meaning and interpretation of association (or correlation or relationship or covariation) and regression as well as the interpretation of the specific statistics. Staple your work together using this as a cover sheet. Have a good break!


