4.2 Statistical Indicies
advertisement
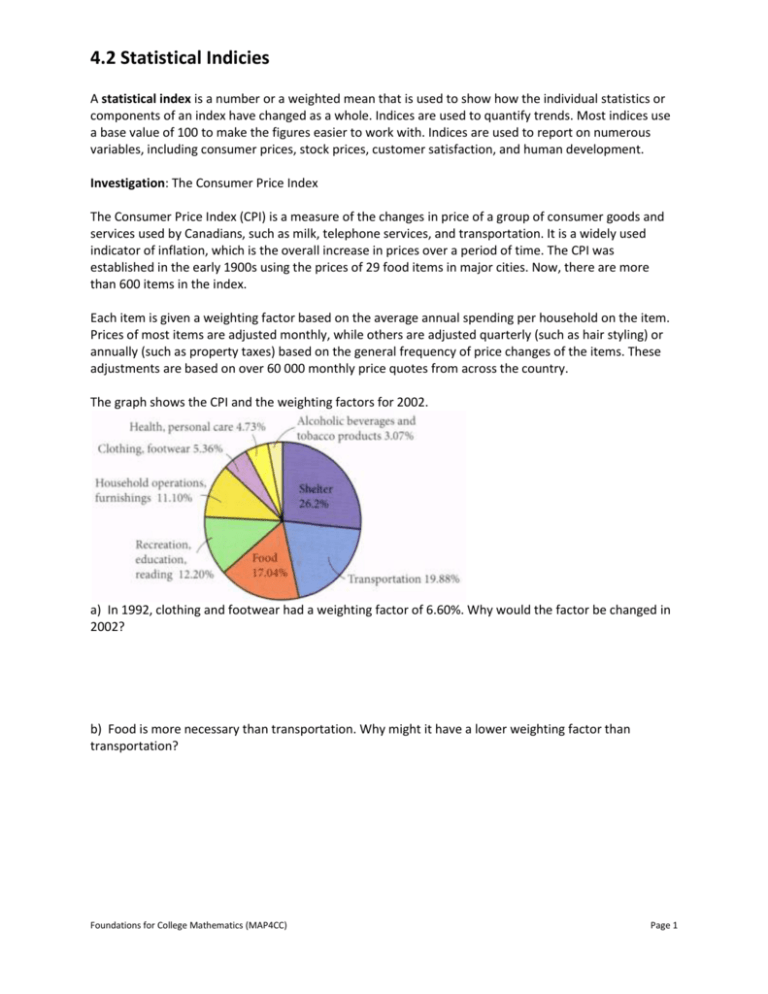
4.2 Statistical Indicies A statistical index is a number or a weighted mean that is used to show how the individual statistics or components of an index have changed as a whole. Indices are used to quantify trends. Most indices use a base value of 100 to make the figures easier to work with. Indices are used to report on numerous variables, including consumer prices, stock prices, customer satisfaction, and human development. Investigation: The Consumer Price Index The Consumer Price Index (CPI) is a measure of the changes in price of a group of consumer goods and services used by Canadians, such as milk, telephone services, and transportation. It is a widely used indicator of inflation, which is the overall increase in prices over a period of time. The CPI was established in the early 1900s using the prices of 29 food items in major cities. Now, there are more than 600 items in the index. Each item is given a weighting factor based on the average annual spending per household on the item. Prices of most items are adjusted monthly, while others are adjusted quarterly (such as hair styling) or annually (such as property taxes) based on the general frequency of price changes of the items. These adjustments are based on over 60 000 monthly price quotes from across the country. The graph shows the CPI and the weighting factors for 2002. a) In 1992, clothing and footwear had a weighting factor of 6.60%. Why would the factor be changed in 2002? b) Food is more necessary than transportation. Why might it have a lower weighting factor than transportation? Foundations for College Mathematics (MAP4CC) Page 1 4.2 Statistical Indicies c) If there were a 5% increase in the cost of shelter, how would it affect the CPI? d) If there were a 2% increase in the cost of health and personal care, how would it affect the CPI? 2. The graph shows the value of the CPI since 2002 for the month of May. a) Explain what is meant by 2002 = 100. b) Describe the general trend in the CPI. c) Which one-year span had the greatest increase in the CPI? Foundations for College Mathematics (MAP4CC) Page 2 4.2 Statistical Indicies d) Which one-year span had the least increase in the CPI? e) By what percent have prices increased between 2002 and 2007? f) By what percent have prices increased between 2002 and 2008? g) By what percent have prices increased between 2007 and 2008? 3. How can you use CPI data to describe the change in the cost of living? Example 1: Toronto Stock Exchange (TSX) Index The primary index for the Toronto Stock Exchange is known as the TSX Composite Index. The graph shows the TSX Composite Index from January 01, 2000 to August 15, 2008. The top portion of the graph shows the value of the index. The bottom portion shows the volume of sales, in billions of dollars per month. Foundations for College Mathematics (MAP4CC) Page 3 4.2 Statistical Indicies a) By what factor did the index grow from January 1, 2000 to September 1, 2000? b) By what factor did the index fall from September 1, 2000 to October 9, 2002? c) What was the percent change in the index between August 15, 2007 and August 15, 2008? d) What was the percent change in the index from October 1, 2008 to October 10, 2008? e) Describe the trend in sales volume over most of the period. Example 2: Farm Product Price Index The Farm Product Price Index (FPPI) follows the prices farmers receive for their products. In April 2008, the FPPI (1997 = 100) stood at 119.7. Sub-index weightings for 2008 were Crops 45.4% and Livestock 54.6%. Each sub-index is broken down into basic-indices representing, for example, grain, fruit, cattle, eggs, and so on. a) Explain what is meant by 1997 = 100, and how it relates to 2008. Foundations for College Mathematics (MAP4CC) Page 4 4.2 Statistical Indicies b) In April 2008, the Crop sub-index had a value of 144.2 and the Livestock sub-index had a value of 99.4. Show how these values are used to determine the value of the FPPI. c) If the Crop sub-index increased by 1% and the Livestock sub-index decreased by 0.5%, calculate the new value of the FPPI. Key Concepts: A statistical index is a weighted mean of its components. An index is an indicator of the level of related components, such as prices or pollutants An index is often used to compare changes in values over time. Practice Activity 1. For help with question 1, refer to the investigation The CPI weighting for milk is 0.69% and for tea is 0.06%, because people spend more money on milk than on tea. How would the effects of a 3% increase in the price of milk compare to a 3% increase in the price of tea? 2. For help with question 2, refer to example 1 The Air Quality Health Index (AQHI) measures the level of many air pollutants. It has a scale from 1 (low health risk) to 10 (high health risk). On rare occasions, the index may be greater than 10, which means a very high health risk. The graph shows the AQHI for Toronto for one week. a) Estimate the value of the index for each day of the week. Classify the health risk for each day. b) By what factor did the index increase between Wednesday and Thursday? c) Calculate the percent increase in the index from Sunday to Friday. d) What might explain the pattern in the readings? Foundations for College Mathematics (MAP4CC) Page 5 4.2 Statistical Indicies 3. For help with questions 3, refer to Example 1. Refer to the TSX Composite Index graph in Example 1. a) By what factor did the index grow between October 9, 2003 and June 18, 2008? b) By what percent did the index grow between October 9, 2003 and June 18,2008? c) By what percent did the index fall between June 18, 2008 and October 10, 2008? Foundations for College Mathematics (MAP4CC) Page 6

