Levels_precip_evap_runoff - International Upper Great Lakes Study
advertisement

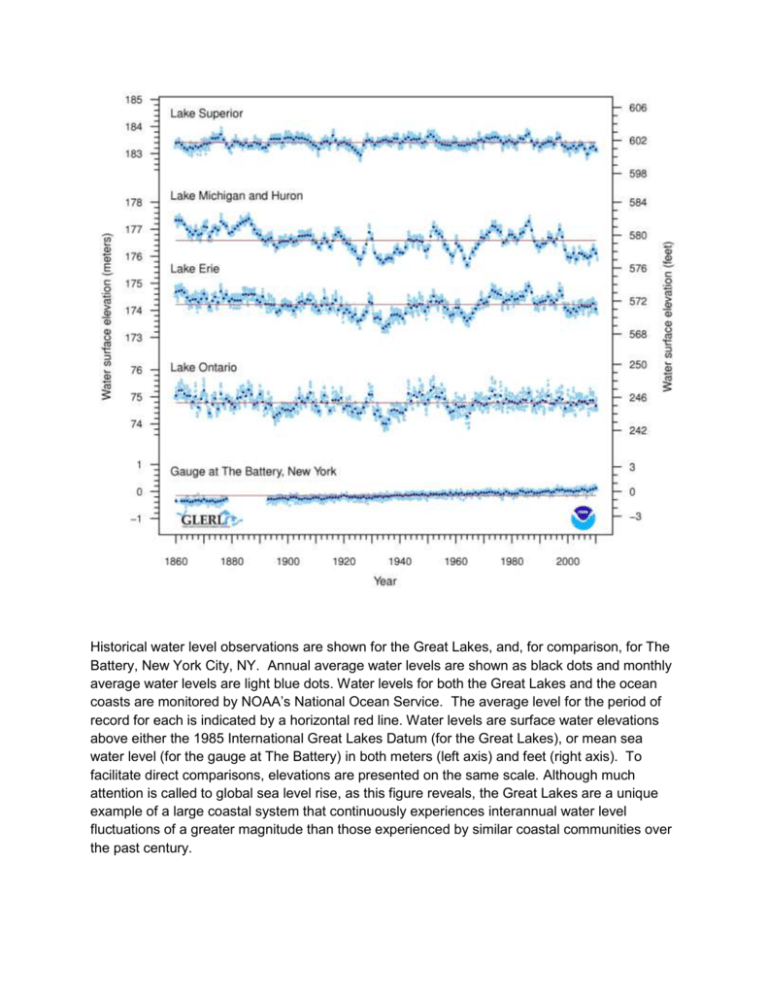
Historical water level observations are shown for the Great Lakes, and, for comparison, for The Battery, New York City, NY. Annual average water levels are shown as black dots and monthly average water levels are light blue dots. Water levels for both the Great Lakes and the ocean coasts are monitored by NOAA’s National Ocean Service. The average level for the period of record for each is indicated by a horizontal red line. Water levels are surface water elevations above either the 1985 International Great Lakes Datum (for the Great Lakes), or mean sea water level (for the gauge at The Battery) in both meters (left axis) and feet (right axis). To facilitate direct comparisons, elevations are presented on the same scale. Although much attention is called to global sea level rise, as this figure reveals, the Great Lakes are a unique example of a large coastal system that continuously experiences interannual water level fluctuations of a greater magnitude than those experienced by similar coastal communities over the past century. Historical gauge-based basin-wide precipitation estimates in millimeters for the Great Lakes. Annual precipitation estimates are shown as quantities above (green) or below (orange) the long-term average for each lake for the period of record. The precipitation data is from landbased gauges in the U.S. and Canada. Simulated annual over-lake evaporation in millimeters based on GLERL’s Large Lake Thermodynamics Model. Orange vertical bars represent annual evaporation greater than the long term average while green vertical bars represent annual evaporation rates below the average. Total annual over-land runoff in millimeters over the lake surface. The runoff is computed from streamflow site data (U.S. and Canadian) using a simple interpolation method developed at GLERL.


