Probability: What Affects Estimates
advertisement
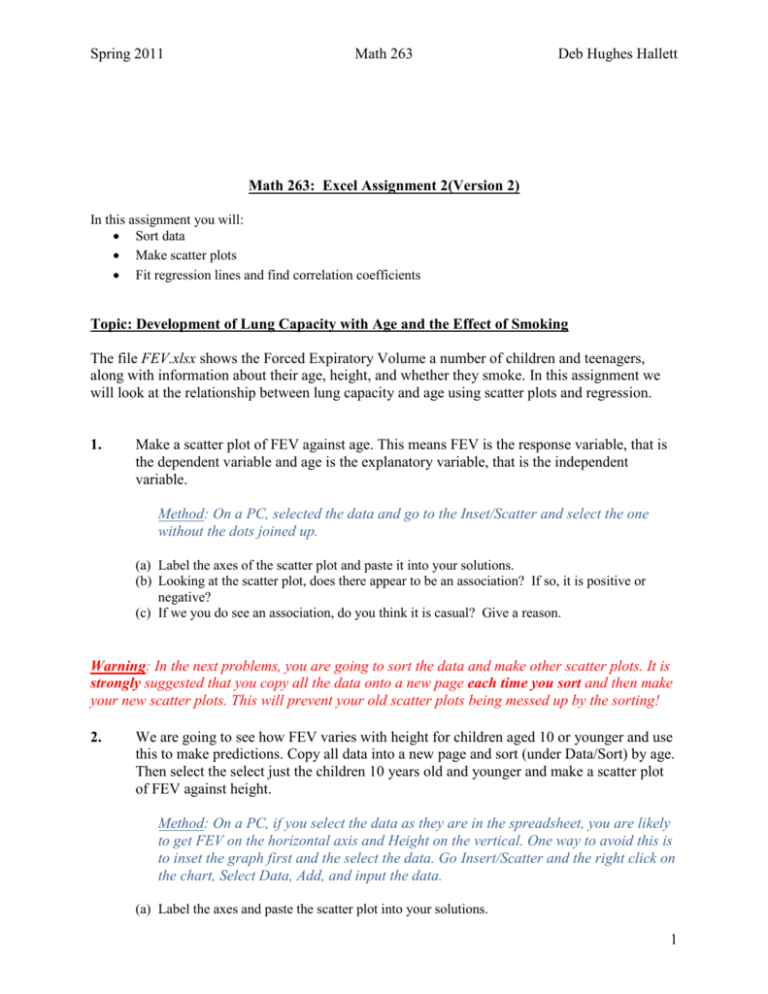
Spring 2011 Math 263 Deb Hughes Hallett Math 263: Excel Assignment 2(Version 2) In this assignment you will: Sort data Make scatter plots Fit regression lines and find correlation coefficients Topic: Development of Lung Capacity with Age and the Effect of Smoking The file FEV.xlsx shows the Forced Expiratory Volume a number of children and teenagers, along with information about their age, height, and whether they smoke. In this assignment we will look at the relationship between lung capacity and age using scatter plots and regression. 1. Make a scatter plot of FEV against age. This means FEV is the response variable, that is the dependent variable and age is the explanatory variable, that is the independent variable. Method: On a PC, selected the data and go to the Inset/Scatter and select the one without the dots joined up. (a) Label the axes of the scatter plot and paste it into your solutions. (b) Looking at the scatter plot, does there appear to be an association? If so, it is positive or negative? (c) If we you do see an association, do you think it is casual? Give a reason. Warning: In the next problems, you are going to sort the data and make other scatter plots. It is strongly suggested that you copy all the data onto a new page each time you sort and then make your new scatter plots. This will prevent your old scatter plots being messed up by the sorting! 2. We are going to see how FEV varies with height for children aged 10 or younger and use this to make predictions. Copy all data into a new page and sort (under Data/Sort) by age. Then select the select just the children 10 years old and younger and make a scatter plot of FEV against height. Method: On a PC, if you select the data as they are in the spreadsheet, you are likely to get FEV on the horizontal axis and Height on the vertical. One way to avoid this is to inset the graph first and the select the data. Go Insert/Scatter and the right click on the chart, Select Data, Add, and input the data. (a) Label the axes and paste the scatter plot into your solutions. 1 Spring 2011 Math 263 Deb Hughes Hallett (b) Now fit a regression line to the data. Method: On a PC, right click on the data points and select Add Trendline. The dialog box will default to Linear, which is what you want. Check the boxes Display Equation and Display 𝑅 2value. (c) What are the units of the slope of the regression line you have just created? (d) What is interpretation of the slope of the regression line in terms of children? (e) Using the equation of the regression line you have just created, predict the FEV of a 5 foot (60 inch) child of age 10 or less. Give two decimal places and units in your answer. Now we are going to compute the correlation coefficient between FEV and age for children aged 11 and over. We are going to do this separately for smokers and nonsmokers. Copy all the data into a new page. Delete the children of 10 or less and sort the remainder by smokers (Smoke = 1) and nonsmokers (Smoke = 0). (Alternatively, you can sort by smokers and then inside that by age.) 3. (a) Find the correlation coefficient between FEV and age for the smokers. Method: You can either use = CORREL(array1, array2) or draw a scatter plot and find 𝑅 2 and then 𝑟. (b) Find the correlation coefficient between FEV and age for the non-smokers. (c) Comment on the difference between two correlation coefficients. What does this suggest about smoking and FEV? . 2

