Scottish Water`s Rebaselined Carbon Footprint
advertisement

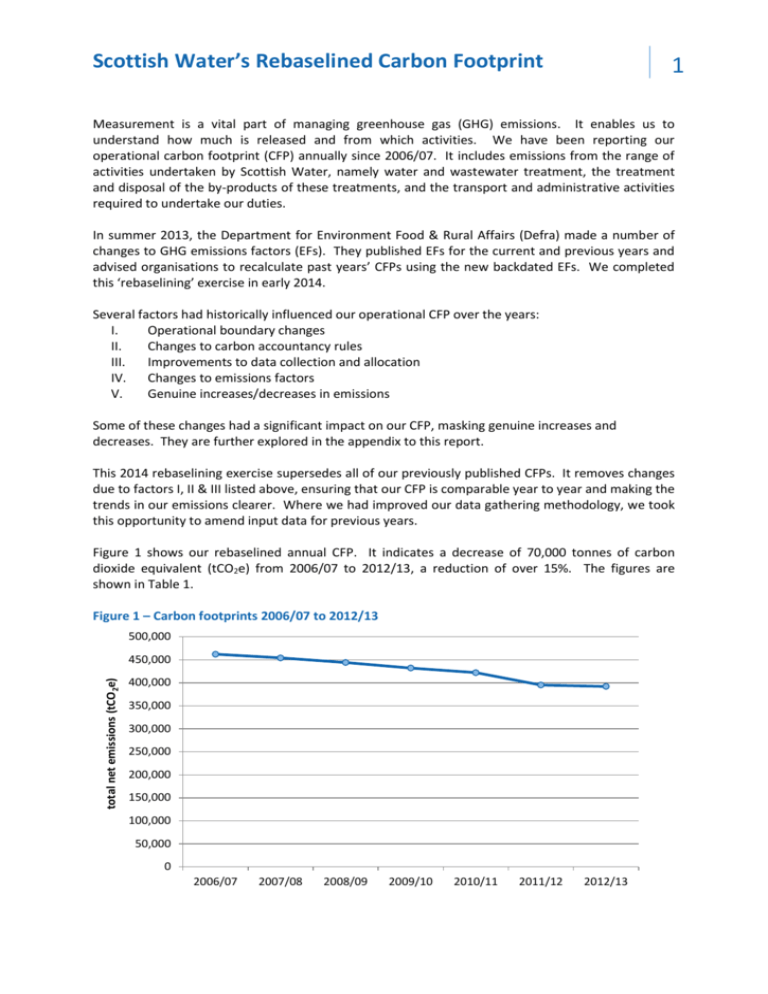
Scottish Water’s Rebaselined Carbon Footprint 1 Measurement is a vital part of managing greenhouse gas (GHG) emissions. It enables us to understand how much is released and from which activities. We have been reporting our operational carbon footprint (CFP) annually since 2006/07. It includes emissions from the range of activities undertaken by Scottish Water, namely water and wastewater treatment, the treatment and disposal of the by-products of these treatments, and the transport and administrative activities required to undertake our duties. In summer 2013, the Department for Environment Food & Rural Affairs (Defra) made a number of changes to GHG emissions factors (EFs). They published EFs for the current and previous years and advised organisations to recalculate past years’ CFPs using the new backdated EFs. We completed this ‘rebaselining’ exercise in early 2014. Several factors had historically influenced our operational CFP over the years: I. Operational boundary changes II. Changes to carbon accountancy rules III. Improvements to data collection and allocation IV. Changes to emissions factors V. Genuine increases/decreases in emissions Some of these changes had a significant impact on our CFP, masking genuine increases and decreases. They are further explored in the appendix to this report. This 2014 rebaselining exercise supersedes all of our previously published CFPs. It removes changes due to factors I, II & III listed above, ensuring that our CFP is comparable year to year and making the trends in our emissions clearer. Where we had improved our data gathering methodology, we took this opportunity to amend input data for previous years. Figure 1 shows our rebaselined annual CFP. It indicates a decrease of 70,000 tonnes of carbon dioxide equivalent (tCO2e) from 2006/07 to 2012/13, a reduction of over 15%. The figures are shown in Table 1. Figure 1 – Carbon footprints 2006/07 to 2012/13 500,000 total net emissions (tCO2e) 450,000 400,000 350,000 300,000 250,000 200,000 150,000 100,000 50,000 0 2006/07 2007/08 2008/09 2009/10 2010/11 2011/12 2012/13 2 Scottish Water’s Rebaselined Carbon Footprint Table 1 – Carbon footprints 2006/07 to 2012/13 2006/07 2007/08 2008/09 total net emissions (tCO2e) 462,000 454,000 444,000 2009/10 2010/11 2011/12 2012/13 432,000 422,000 395,000 392,000 By breaking down the CFP in different ways, it is possible to see how separate parts of the CFP have changed year on year. Figure 2 shows how the proportion of emissions relating to separate activities has changed over time. It is clear that our waste water services (green and dark red on the chart) are responsible for more than double the emissions from our water services. This is mainly due to Scotland’s distributed population, which requires many small waste water treatment works, thereby losing economies of scale. In many areas we also need to meet stringent water quality standards for bathing waters, shellfish waters and other designated areas, requiring energy intense processes. Figure 2 – Carbon footprints split by activity emissions by activity tCO2e 500,000 400,000 300,000 200,000 100,000 0 2006/07 2007/08 Drinking water treatment and pumping Administrative activities 2008/09 2009/10 Wastewater treatment and pumping Transport 2010/11 2011/12 2012/13 Sludge treatment, recycling and disposal A change can be seen in the allocation of emissions between ‘wastewater treatment & pumping’ and ‘sludge treatment & recycling’. This is due to a methodology improvement in 2008/09 for processing PFI1 electricity data. We are unable to correct these first two years because calculating our CFP was then undertaken by consultants. In 2008/09 we took on the task ourselves. As this is a redistribution of data, it does not affect the total CFP for those years. We therefore keep them as part of our trend. We can look at our CFP another way, breaking it down by source of emissions. This is shown in Figure 3. It is clear from Figure 3 that grid electricity is the major contributor to our emissions, being responsible for more emissions than all our other sources combined. The vast majority of electricity is used in the operational side of our business (i.e. for drinking water and wastewater pumping and treatment, and for sludge treatment), with very little attributable to administrative use. This is reflected in the small purple segments in Figure 2. 1 Some of our WwTW are run on our behalf by Private Finance Initiative (PFI) companies. 3 Scottish Water’s Rebaselined Carbon Footprint Figure 3 – Carbon footprints split by source Emissions by source, tCO2e 500,000 400,000 300,000 200,000 100,000 0 2006/07 2007/08 2008/09 2009/10 2010/11 2011/12 2012/13 -100,000 Electricity Sludge (process)emissions Waste emissions Natural gas Renewable generation Other fuels Ozone Figure 4 shows how our grid electricity use and the associated emissions have changed. Both show a general downward trend. There are a number of causes, some of which are under our control, such as leakage reduction; and some of which are not, such as changes to grid electricity EFs. The red line is our electricity use; the blue line is the emissions associated with that use. If EFs were constant from year to year, the lines would be the same shape. Figure 4 reflects the effect of grid EFs that change from year to year depending on how the country’s electricity is generated. Put simply, more electricity generation from fossil fuels (such as coal and gas) will cause the emissions factor to rise (more emissions for a fixed amount of electricity use); more electricity generation from renewables (such as wind, hydro and solar) will cause the emissions factor to fall (fewer emissions for a fixed amount of electricity use). 640 320,000 620 310,000 600 300,000 580 290,000 560 280,000 540 270,000 520 260,000 500 Grid electricity emissions (tCO2e) Grid electricity consumption (GWh) Figure 4 – Grid electricity emissions compared to grid electricity consumption 250,000 2006/07 2007/08 2008/09 2009/10 Consumption 2010/11 2011/12 2012/13 Emissions It is the government’s policy to reduce reliance on high carbon fossil fuels and generate more electricity from renewable sources. This is known as ‘decarbonising the grid’ and is a very important factor in reducing GHG emissions to meet targets set in the Climate Change Act. Scottish Water’s Rebaselined Carbon Footprint 4 Appendix – Factors negated by the rebaselining exercise I. Operational boundary changes Over the years we have been reporting our carbon footprint, UK Water Industry Research (UKWIR) has made several significant changes to the recommended operational boundary. The 2014 rebaselining exercise negated these by applying the current operational boundary to all past years. II. Changes to carbon accountancy rules The methodology for accounting for renewable energy takes into account whether the generated electricity is Renewable Energy Guarantee of Origin (REGO) accredited. The 2014 rebaselining exercise negated past changes by applying the current accountancy rules to all past years. III. Improvements to data collection and allocation With each CFP, the process of collecting and analysing our data is refined in order to improve the accuracy of the footprint. Over the years, we have made significant improvements in the collection and correct allocation of data within the Carbon Accounting Workbook (CAW). For example: i. Improving allocation of grid electricity and natural gas between activities ii. Improving data coverage of operations and activities within Scottish Water’s CFP boundary iii. Improving allocation of sludge data to treatment type and end use iv. Improving identification and allocation of minor fuels, such as LPG and kerosene The 2014 rebaselining applied these previous improvements to all past years. IV. Changes to emissions factors Emissions factors (EFs) are used to convert source data (e.g. litres of fuel or kWh of electricity) into GHG emissions. The CAW uses Defra EFs for the appropriate year for carbon dioxide (CO2), methane (CH4) and nitrous oxide (N2O) as well as a range of refrigerant gases. The majority of EFs remain reasonably constant between years. The exception is grid electricity, as explained in relation to Figure 4, above. When Defra made significant changes to EFs in summer 2013, they recommended that organisations recalculate their previous years’ CFPs based on the newly published figures. To avoid confusion with our previously published CFPs, we have withdrawn ‘old’ CFP reports from our website. Our CFPs for 2006/07 to 2012/13 are presented above. CFPs for 2013/14 onwards will be published as part of our Sustainability Report and are comparable with the rebaselined CFPs included here. During our 2014 rebaselining exercise, those EFs that are constant in Defra’s new approach were applied to all past years. Those EFs that change annually in Defra’s new approach were applied to the year to which they were relevant and will continue to change in future years. For example, the grid electricity EF is now a one-year average. Using a single-year figure removes the smoothing effect of the previously used 5 year rolling average. For Scottish Water, with such a large proportion of our CFP due to our use of grid electricity, this is likely to give rise to a less predictable CFP year-to-year. V. Genuine increases/decreases in emissions With this rebaselining exercise complete, it should be clearer to see genuine changes in our CFP in future. Although there will be some changes due to EFs, as outlined above, the majority of changes we will see should be genuine changes to our emissions.


