Handout: Measurement Units
advertisement
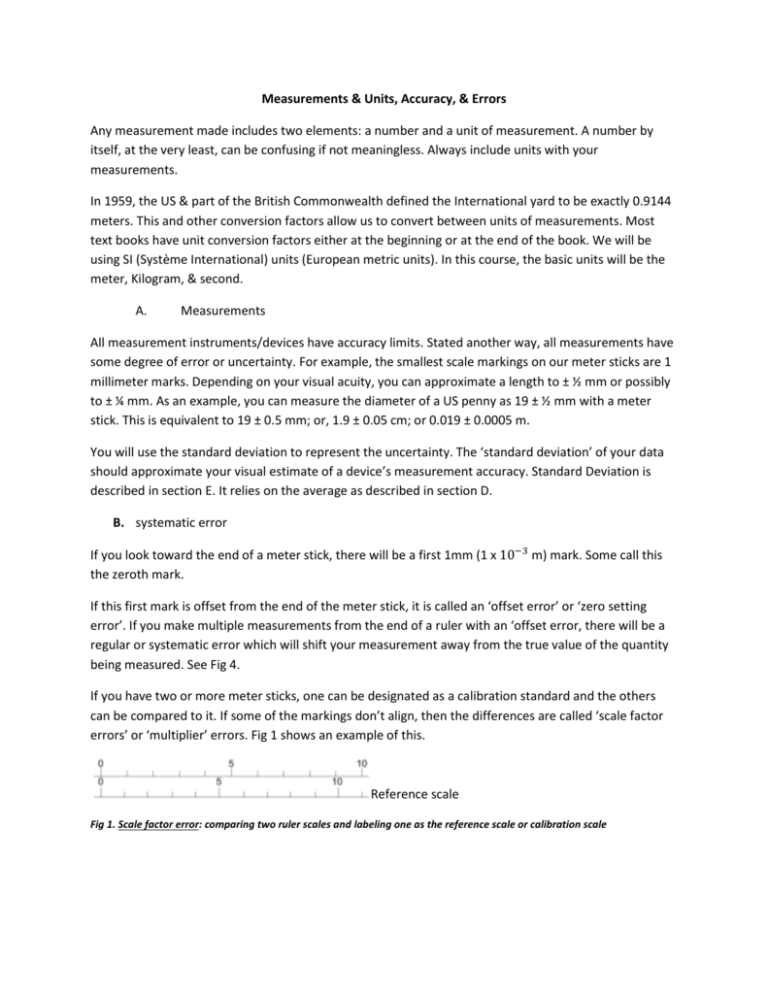
Measurements & Units, Accuracy, & Errors Any measurement made includes two elements: a number and a unit of measurement. A number by itself, at the very least, can be confusing if not meaningless. Always include units with your measurements. In 1959, the US & part of the British Commonwealth defined the International yard to be exactly 0.9144 meters. This and other conversion factors allow us to convert between units of measurements. Most text books have unit conversion factors either at the beginning or at the end of the book. We will be using SI (Système International) units (European metric units). In this course, the basic units will be the meter, Kilogram, & second. A. Measurements All measurement instruments/devices have accuracy limits. Stated another way, all measurements have some degree of error or uncertainty. For example, the smallest scale markings on our meter sticks are 1 millimeter marks. Depending on your visual acuity, you can approximate a length to ± ½ mm or possibly to ± ¼ mm. As an example, you can measure the diameter of a US penny as 19 ± ½ mm with a meter stick. This is equivalent to 19 ± 0.5 mm; or, 1.9 ± 0.05 cm; or 0.019 ± 0.0005 m. You will use the standard deviation to represent the uncertainty. The ‘standard deviation’ of your data should approximate your visual estimate of a device’s measurement accuracy. Standard Deviation is described in section E. It relies on the average as described in section D. B. systematic error If you look toward the end of a meter stick, there will be a first 1mm (1 x 10⁻³ m) mark. Some call this the zeroth mark. If this first mark is offset from the end of the meter stick, it is called an ‘offset error’ or ‘zero setting error’. If you make multiple measurements from the end of a ruler with an ‘offset error, there will be a regular or systematic error which will shift your measurement away from the true value of the quantity being measured. See Fig 4. If you have two or more meter sticks, one can be designated as a calibration standard and the others can be compared to it. If some of the markings don’t align, then the differences are called ‘scale factor errors’ or ‘multiplier’ errors. Fig 1 shows an example of this. Reference scale Fig 1. Scale factor error: comparing two ruler scales and labeling one as the reference scale or calibration scale If a series of distance or length measurements are made and then graphed, the graph of the actual measurements will differ from that of an ideal or perfect measurement device as indicated in Fig 2. Fig 2. Systematic errors of a typical ruler or meter stick (solid line) vs a perfect/idealized ruler that is without any error (dashed line) Note: the cause for errors can be difficult to determine but should always be considered & evaluated. C. Random error When making measurements, some modest random variation in measurements is common. Occasionally, an individual measurement may dramatically differ from the others. The cause for dramatic differences should be explored and explained. An example of a dramatic measure difference is based on the fact that most of the length measurement devices we use come with both US units and metric units. Careless switching of scales might account for some dramatic measurement differences. Other measurement differences may be caused by using more than one meter stick, ruler, etc. In addition, measurement skill, technique, and attention to details will vary to some degree. Consider these moderate variations as random and will deal with them as follows: D. Average The value that best represents any particular diameter is the mean or average of the correlated data set. The formula for the average is given by: Equation 1. the formula for ‘average’ Where is the generic symbol for the average quantity and is the generic symbol for the individual measurements. The subscript i is an index that stands for the number of the measurement you’ve made: the subscript 1 for the first measurement, 2 for the second, 3 for the third & N for the 𝑁 𝑡ℎ measurement, where N is also the total number of measurements. E. Standard Deviation Calculate the difference of the measurements from the average by subtracting . This value is not very useful since the average of this quantity is nearly zero every time. So, if you square this value and then take an “average” You’ll get a number called the variance (see Equation 2 below.), the square root of this is called the standard deviation σ. We will be dividing by N-1 instead of N, this has to do with the fact that we are working with a sample of a population and not the entire population. The formula for the variance is as follows: Equation 2. the formula for variance The uncertainty in the data set will be taken to be the standard deviation of the data set, which is given by: Other examples of causes of random errors are: electronic noise in the circuit of an electrical instrument, irregular changes in the heat loss rate from a solar collector due to changes in the wind. Other examples of systematic errors caused by the improper or inappropriate use of an instrument are: errors in measurements of temperature due to poor thermal contact between the thermometer and the substance whose temperature is to be found, errors in measurements of solar radiation because trees or buildings shade the radiometer. F. The precision of a measurement increases as the standard deviation decreases. Actual value measured value with offset Fig 3. Accuracy indicates proximity of measurement results to the true value, precision refers to the repeatability or reproducibility of the measurement G. The accuracy of a measurement is how close the measurement is to the true value of the quantity being measured. Fig 4. High precision, but low accuracy Fig 6. Low precision and low accuracy Fig 5. High accuracy, but low precision
