Understanding your social vulnerability to climate
advertisement
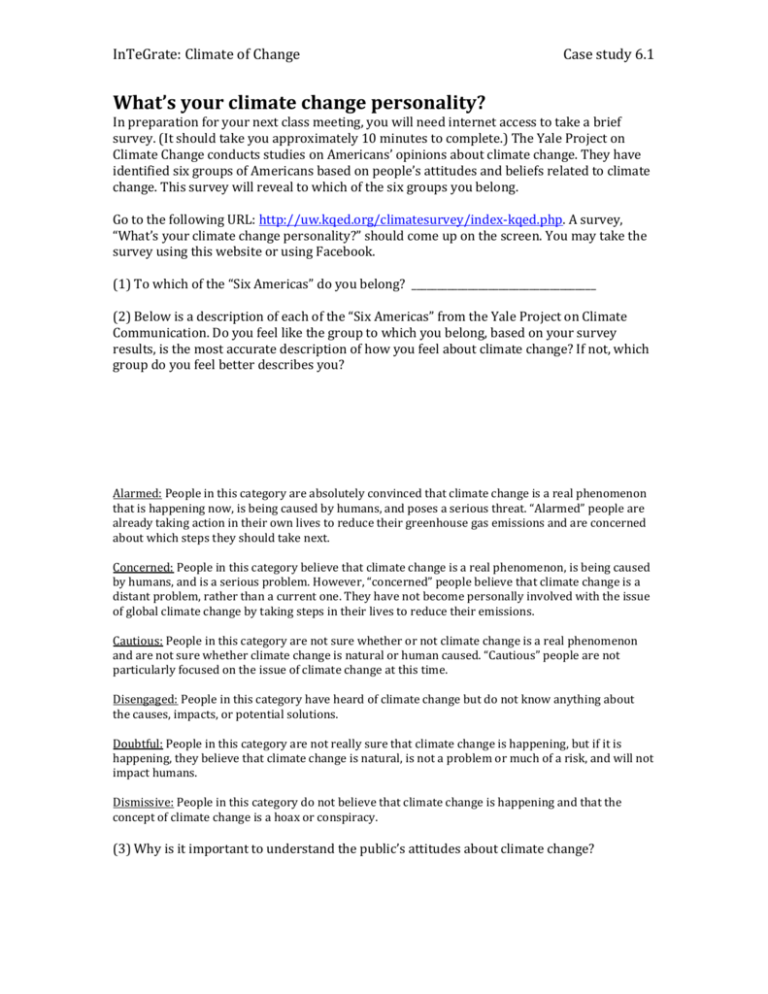
InTeGrate: Climate of Change Case study 6.1 What’s your climate change personality? In preparation for your next class meeting, you will need internet access to take a brief survey. (It should take you approximately 10 minutes to complete.) The Yale Project on Climate Change conducts studies on Americans’ opinions about climate change. They have identified six groups of Americans based on people’s attitudes and beliefs related to climate change. This survey will reveal to which of the six groups you belong. Go to the following URL: http://uw.kqed.org/climatesurvey/index-kqed.php. A survey, “What’s your climate change personality?” should come up on the screen. You may take the survey using this website or using Facebook. (1) To which of the “Six Americas” do you belong? ____________________________________ (2) Below is a description of each of the “Six Americas” from the Yale Project on Climate Communication. Do you feel like the group to which you belong, based on your survey results, is the most accurate description of how you feel about climate change? If not, which group do you feel better describes you? Alarmed: People in this category are absolutely convinced that climate change is a real phenomenon that is happening now, is being caused by humans, and poses a serious threat. “Alarmed” people are already taking action in their own lives to reduce their greenhouse gas emissions and are concerned about which steps they should take next. Concerned: People in this category believe that climate change is a real phenomenon, is being caused by humans, and is a serious problem. However, “concerned” people believe that climate change is a distant problem, rather than a current one. They have not become personally involved with the issue of global climate change by taking steps in their lives to reduce their emissions. Cautious: People in this category are not sure whether or not climate change is a real phenomenon and are not sure whether climate change is natural or human caused. “Cautious” people are not particularly focused on the issue of climate change at this time. Disengaged: People in this category have heard of climate change but do not know anything about the causes, impacts, or potential solutions. Doubtful: People in this category are not really sure that climate change is happening, but if it is happening, they believe that climate change is natural, is not a problem or much of a risk, and will not impact humans. Dismissive: People in this category do not believe that climate change is happening and that the concept of climate change is a hoax or conspiracy. (3) Why is it important to understand the public’s attitudes about climate change? InTeGrate: Climate of Change Case study 6.1 Understanding your social vulnerability to climate change A community’s vulnerability is determined by considering the possible loss of life or property that could result from environmental hazards. The Hazards and Vulnerability Research Institute also studies the concept of social vulnerability, which is determined by considering the “social, economic, demographic, and housing characteristics that affect a community’s ability to respond to, cope with, recover from, and adapt to environmental hazards.” Most scientists consider climate change as an environmental hazard. What is your social vulnerability to climate change? Navigate to the following URL: http://webra.cas.sc.edu/hvri/products/sovifaq.aspx. Please read the section entitled, “What Population Characteristics Affect Vulnerability?”, Each characteristic has a description and one or more categories with a + or – following them. The + and – refers to whether or not the category increases (+) or decreases (-) social vulnerability. For example, under “Residential property”, living in a mobile home increases (+) one’s social vulnerability to environmental hazards. (1) In the table below, please: (a) characterize yourself as either “vulnerable” or “not vulnerable” for each category. (b) think about your community as a whole and characterize your community as either “vulnerable” or “not vulnerable” for each category. Your vulnerability Population characteristic vulnerable not vulnerable Community’s vulnerability vulnerable not vulnerable Socioeconomic status Gender Race and ethnicity Age Employment loss Rural/Urban Residential property Renters Occupation Family structure Education Medical services Social dependence Special-needs population Finally, go to the following URL: http://webra.cas.sc.edu/hvri/products/sovi.aspx This map illustrates the 2006-2010 social vulnerability to environmental hazards for each county in the United States. The red represents the most vulnerable 20% of counties in the US. The blue represents the least vulnerable 20% of counties in the US. The white represents the middle 60% with respect to vulnerability in the US. (2) Find your county on the map. Does your county have a low, medium, or high social vulnerability to environmental hazards? Which factors do you believe are playing a role in your county’s vulnerability?

